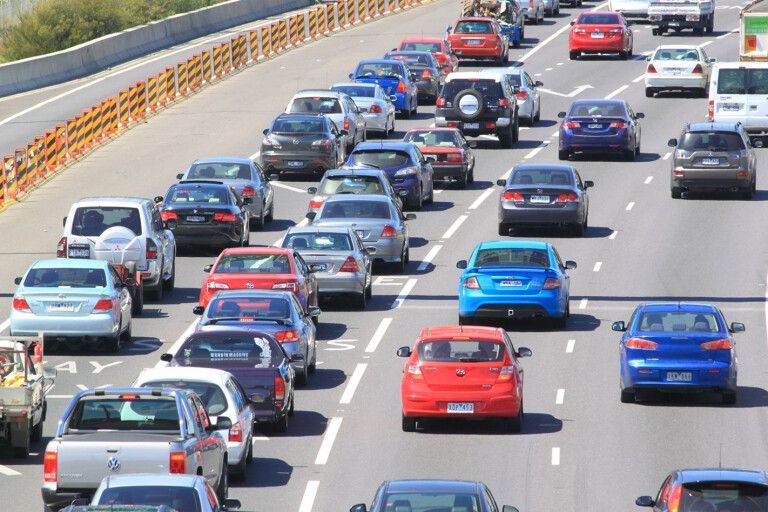
Aussie car owners drove the equivalent of almost half-way to the moon over the 12 months to June 30 last year, the latest snapshot of how we use vehicles shows.
The latest Australian Bureau of Statistics (ABS) data shows trips in passenger cars alone for the period totalled a combined 175 billion kilometres, up from 156 billion. Pitch in the journeys made by trucks, buses, motorcycles and the like, and we travelled almost a quarter of a trillion kays.
And if you think the week-daily commute was a bit of a slog, we travelled more than 48 billion kilometres just going to and from work, the data shows, well up on 2014’s figure of 44.9 billion.
The number of passenger cars on our roads grew only slightly compared with the previous survey’s results, rising by almost 300,000 to 13.7 million. Overall, Australia now has 18.2 million vehicles on its roads, an increase of more than half a million compared with 2014.
However, According to the ABS, despite the bigger distances we travelled overall, the number of kilometres the average car travelled fell to 12,827km, well down on the 13,800km average we travelled in 2014, and the 14,000 average recorded in 2012. Turns out it’s the lowest figure we’ve seen since 2007.
| Top 10 most popular vehicles in Aus- January 2017
We’re definitely driving our cars less in capital cities, with the distance covered falling from 110 billion kilometres last year to 99.5 billion in 2016. In contrast, trips made in other urban zones rose by 4.3 billion kilometres to 32.7 billion. Rural road use, meanwhile, rose from 3.04 billion kilometres in 2014 to 36.8 billion.
We’re chewing through only marginally less fuel, though, with the statistics showing the average fuel use across all passenger vehicles fell to an average of 10.6L/100km, down just 0.1L/100km compared with the 2014 figures.
All up, Aussie passenger cars consumed 18,606 megalitres of fuel over the 12-month period, or about the equivalent of 620 Olympic-sized pools a month. Before you get upset, that’s six fewer pools of fuel a month than we used in 2014. The highest average fuel use figures – 11.0L/100km – were recorded in NSW and South Australia, both up by 0.5L/100km over 2014’s numbers.
New South Wales, the state with the most vehicles (5.3 million), covered the most distance (70 billion kilometres) in 2016. In contrast, the 118,000 vehicles in the Northern Territory covered only 2.0 billion kilometres, making it the don’t-stray-too-far-from-home capital of Australia.
If you’re in the market for a motorcycle, the average distance they travel each year continues to fall. The figure for two-wheelers was only 2600km a year, well down on the 3700km pegged in 2007.
In contrast, the average distance travelled for “articulated trucks”, more colloquially known as semi-trailers, was 79,000 kilometres, also well down on the 93,200km average back in 2007. They also posted the highest fuel-use average – 53.6 litres per 100 kilometres.
COMMENTS