Opinion
Gallery1
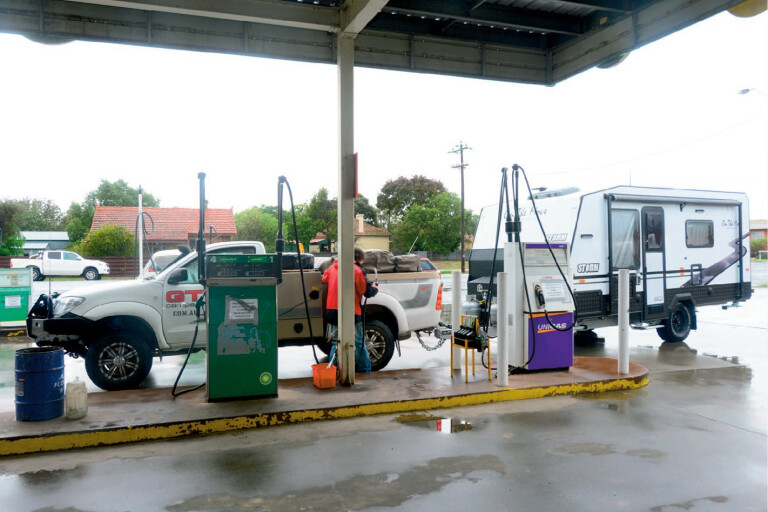
I JUST about choked on my coffee when the morning TV news announced that – shock, horror – new cars use more fuel and produce more greenhouse gas than what’s claimed on the government-mandated yellow windscreen label.
The news came off the back of a press release from the AAA, Australia’s peak motoring organisation that represents the various state and territory based motoring ‘clubs’, the NRMA, RACV, RACQ, RAA, RAC, RACT and AANT, names no doubt familiar to most readers.
So how long did the AAA take to work this out?
The fact that the fuel labels, which give a fuel-use figure obtained in a laboratory and not on the road (see breakout), significantly understate real-word fuel use has been well documented for more than half a decade across all sort of motoring publications, both print and online, and even in the general media, TV included.
It’s also something car buyers have noticed, posing questions like “why does my car use more fuel than what is on the windscreen label?” Even Australian Consumers Association via its magazine Choice, which usually doesn’t delve too far into motoring matters – it’s more into washing machines and vacuum cleaners – published a story on it some six years ago.
 In its release the AAA said that following the recent Volkswagen ‘scandal’ it commissioned real-world fuel-use and emissions testing to see how the results stacked up again figures obtained in a laboratory setting.
The AAA has released some initial findings, with full results to be published in mid-2017. Predicably it suggests: “It’s critical that real-world testing is introduced to ensure motorists aren’t asked to pay more for regulation that fails to deliver environmental benefit.”
Trouble is, if the AAA bothers to think about it sufficiently, real-world testing is hugely expensive and time consuming compared to laboratory testing, and it’s still flawed. The crux of the matter is that real-world testing lacks 100 per cent accurate repeatability and therefore accurate relativity of fuel use between one model and another, which is a key consumer concern. This is something the current laboratory test delivers.
Don't believe the fuel consumption labels
The problems with real-world testing are manifest. First you need to do all the testing on days when the temperature, humidity and wind are all identical, as all these atmospheric factors affect fuel consumption, otherwise out goes repeatability. You’ll also need a consistent traffic pattern and identical density for 100 percent repeatability. Good luck with that!
Then you need one test driver, given that different drivers use differing amounts of fuel on identical roads. Even then you’ll have to hope your driver is 100 per cent consistent from one day to the next. Good luck with that, too.
At this point the AAA would probably say that with enough kilometres over enough days and with a sufficiently large team of drivers all the variations will average out. That’s certainly true, but only to a point. You will never get perfect averaging without doing an infinite numbers of tests. That’s a mathematical given. In fact, you’ll never even get close, given there are so many different models and powertrains within any model range.
Fuel Comparison test: Diesel, petrol or LPG?
For example, Australia’s most popular new car, the Toyota Hilux, has four different engines, four different gearboxes and two different drivelines (4x4 and 4x2), not to mention the different cab and body styles, which all affect weight. All up there are more than 30 different Hilux variants, and Toyota lists more than 20 different ADR fuel figures, figures which don’t take long to establish in a laboratory but would take an inordinate amount of time to achieve in real-world tests. However, we know that the ADR test understates real-world figures, so there is a problem here even if the AAA has just woken up to the fact.
 Given the different ways people use and drive their cars, and the infinite variety of driving environments and traffic conditions encountered, there will never be a definitive fuel-use figure that everyone will experience with any particular vehicle. Whatever figure you come up with will only ever be a best guess in terms of what any particular owner will experience with their new car.
Despite its shortfalls the ADR test shouldn’t be replaced with real-world testing, as it still has value for its base-line relativity and easy process. In fact, it has to remain the starting point for fuel-use measurement until someone comes up with a more accurate in-lab test.
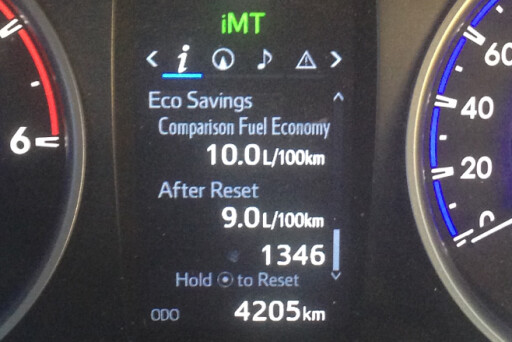
In the meantime there’s an easy and near instant fix to the label problem given there’s a relatively consistent pattern in the way real-world use differs from the ADR laboratory test. The AAA says “20 per cent on average higher” while pointing out some figures “up to 35 per cent higher”. Back in 2011, 4X4 Australia said, “if you want a general guide, add 15 to 30 per cent to the ADR figure and you’ll probably be somewhere near, if not in, the ballpark”.
Instead of squandering countless more millions on real-world testing, probably paid for in the long run by members or customers of the various motoring organisations that the AAA ‘umbrellas’, the AAA could lobby the Federal Government right now to scrap the current ADR figure and replace it with a ‘real-world estimate’ figure.
How? You simply take the current ADR combined-cycle figure and add 20 per cent. Simple. Job done. It would involve very little cost (just printing new stickers) and would be a generally reliable guide for the consumer. If you want to be a bit more non-specific you could quote an estimated real-world range of ADR plus 15-30 per cent and scrap the current urban, extra-urban and combined-cycle figures that seemingly do more to confuse than inform.
BEHIND THE LABEL
FUEL consumption labels attached to the windscreens of new vehicles sold in Australia were first required by law in 2001 for vehicles up to 2700kg Gross Vehicle Mass (GVM) under the Australian Design Rule (ADR) 81/00. Two years later the ADR was amended to include vehicles up to 3500kg GVM, which bought in medium and heavy 4x4s and light commercials. It was known as 81/01. In 2008, ADR 81/02 added separate ‘urban-cycle’ and ‘extra-urban cycle’ fuel-use components to supplement the existing single-figure ‘combined-cycle’ fuel claim.
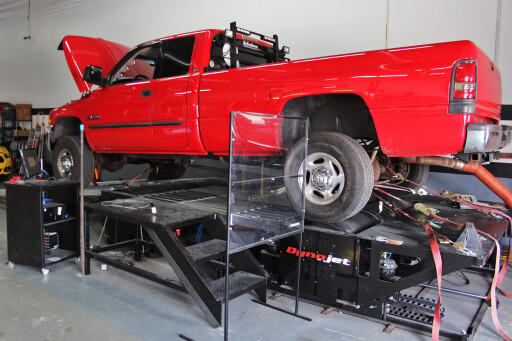
To arrive at the ADR figure the vehicle in question is put through a fixed test sequence in a laboratory on rollers. The ‘test’ covers a theoretical 11km and is done in two parts. The first, or urban cycle, consists of a cold start then a series of accelerations, steady speeds, decelerations and idling. The maximum speed is 50km/h, the average speed is 19km/h and the distance ‘covered’ is 4km.
The extra-urban cycle is conducted straight after the urban cycle and consists of approximately half steady-speed driving with the remainder being accelerations, decelerations and some idling. The average speed is 63km/h, with one spike that reaches 120km/h. The total second test ‘distance’ is 7km.
Tallied together the urban and extra-urban figures become the combined-cycle figure.
Please enable JavaScript to view the comments powered by Disqus.
COMMENTS