
News
Gallery 1
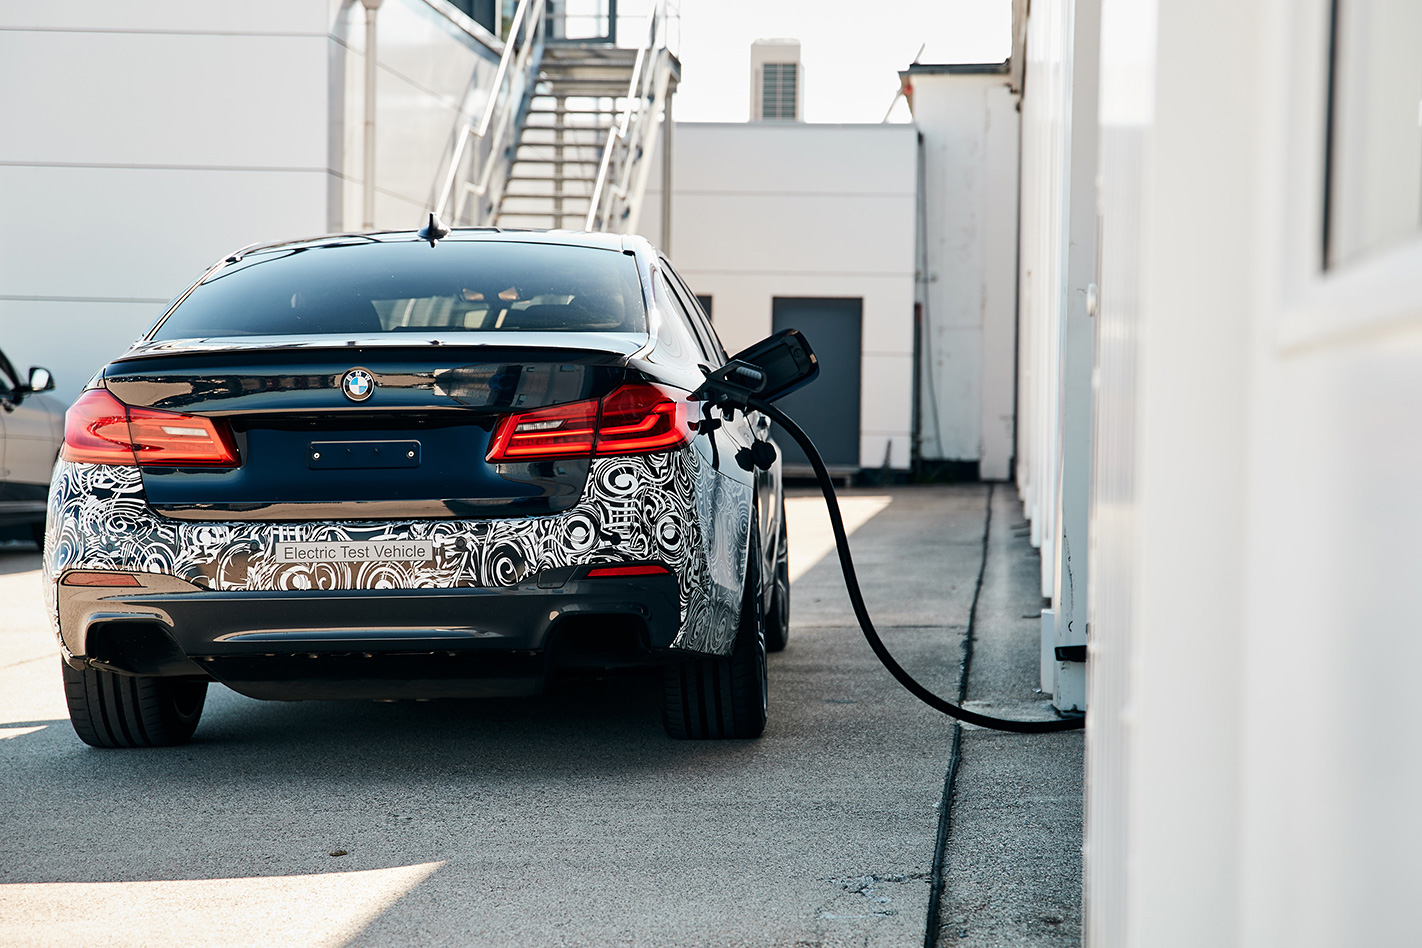
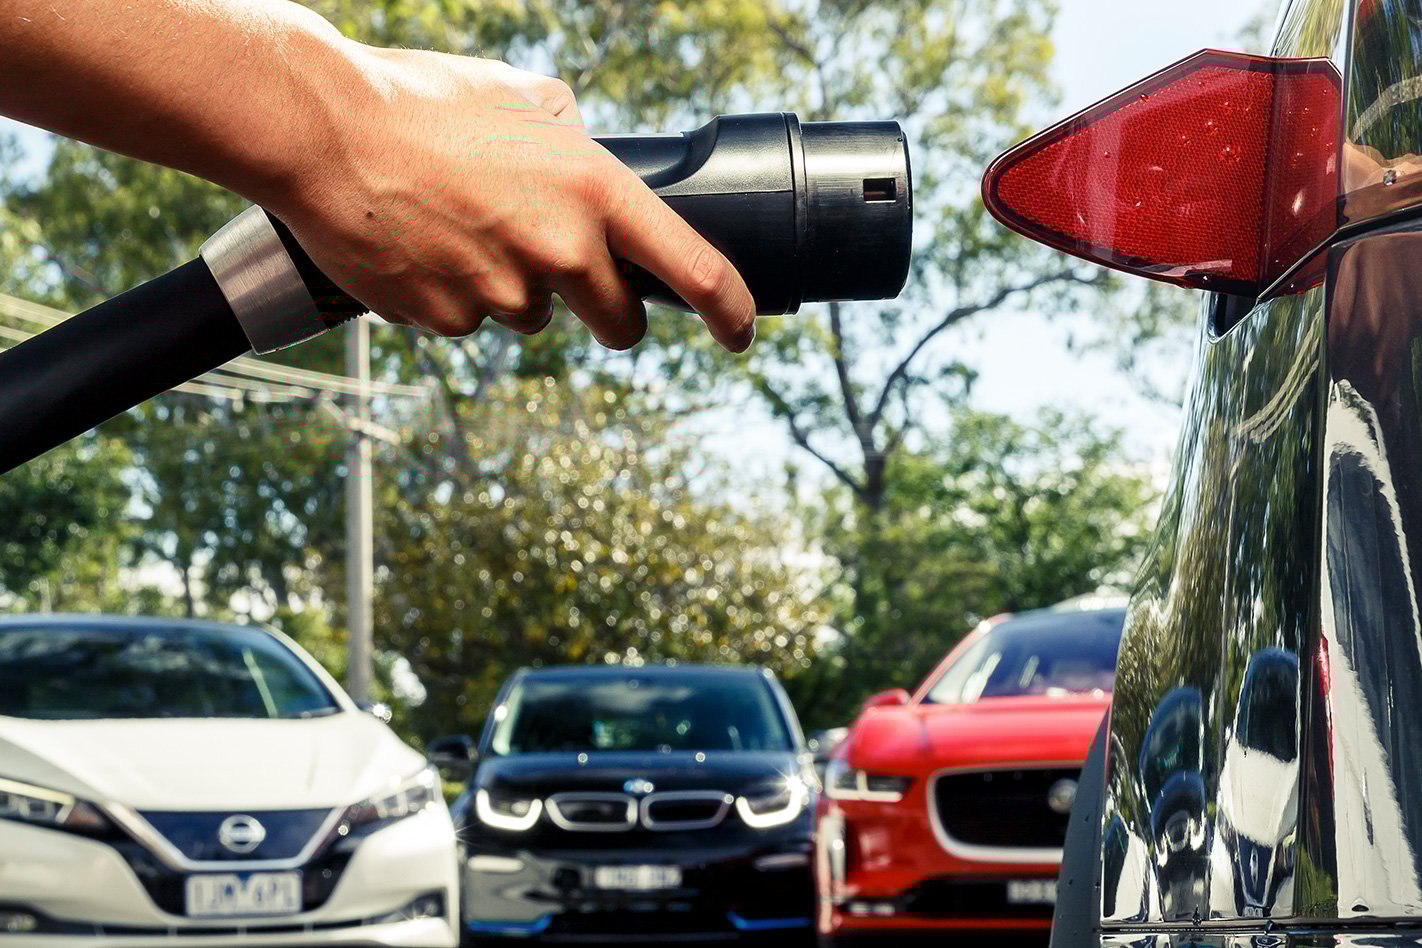
Canberra has been identified as Australia’s most electric vehicle-friendly capital city in a new nationwide study examining charging infrastructure, ownership rates and EV adoption growth.
The report, compiled by insurer ROLLiN’, analysed Greater Capital City Statistical Areas (GCCSAs) across four key measures: the availability of charging infrastructure, public charging costs, current EV ownership levels and the pace of adoption growth since 2021.
The ACT topped the rankings with a score of 84.37 out of 100, driven by the country’s highest EV uptake and strongest charging network density. According to the study, more than three per cent of registered passenger and light vehicles in Canberra are electric, while the city offers more than 80 charging connectors per 100,000 residents.
1
The findings come as electric vehicle adoption in Australia continues to grow. Earlier this year, the Federal Chamber of Automotive Industries reported that one in every six new vehicles sold nationally was electric, reflecting changing consumer priorities around fuel costs, emissions and long-term running expenses.
Perth and Sydney ranked second and third respectively in the study. Both cities recorded EV ownership rates above one per cent of registered vehicles and relatively moderate public charging costs.
The report also found EV adoption is growing rapidly across most Australian capitals, with annual market growth in Perth and Sydney ranging between 95 and 115 per cent since 2021.
Melbourne and Brisbane occupied the middle of the rankings, benefiting from expanding charging infrastructure but facing increasing pressure on charging demand as EV ownership rises.
At the other end of the scale, Darwin ranked eighth overall with a score of 12.01 out of 100. The Northern Territory capital recorded the country’s highest average charging costs at $0.77 per kWh, alongside relatively limited charging infrastructure and EV ownership below one per cent of registered vehicles.
Despite those challenges, Darwin showed the fastest EV adoption growth nationally at 130.5 per cent, suggesting strong emerging interest despite its smaller market size.
| Rank | Greater Capital City Area | Charge Connectors Per 100,000 Population (#) | Weighted Mean Price of Charging ($/ kWh) | EV Share of Registered Vehicles (%) | Growth of EV Share 2021-2025 (CAGR %) | Index Score/100 |
|---|---|---|---|---|---|---|
| 1 | Canberra, ACT | 83.78 | $0.57 | 3.06% | +96.3% | 84.37 |
| 2 | Greater Perth, WA | 63.81 | $0.50 | 1.33% | +107.4% | 62.57 |
| 3 | Greater Sydney, NSW | 46.92 | $0.53 | 1.76% | +95.6% | 53.43 |
| 4 | Greater Adelaide, SA | 43.19 | $0.42 | 1.07% | +108.9% | 48.09 |
| 5 | Greater Brisbane, QLD | 38.26 | $0.60 | 1.67% | +107.2% | 42.69 |
| 6 | Greater Melbourne, VIC | 32.08 | $0.51 | 1.55% | +96.4% | 37.63 |
| 7 | Greater Hobart, TAS | 45.84 | $0.67 | 1.32% | +82.4% | 35.21 |
| 8 | Greater Darwin, NT | 33.90 | $0.77 | 0.63% | +130.5% | 12.01 |
The study noted that charging accessibility remains one of the key barriers to wider EV adoption in Australia, particularly outside metropolitan centres and major highway corridors.
ROLLiN’ executive manager Brendan Griffiths said EVs had shifted from being a niche purchase to a more mainstream transport option, but local infrastructure continued to heavily influence ownership decisions.
“EV-friendly areas are those that support everyday driving with accessible charging, manageable costs and growing local adoption,” Griffiths said.
The report also highlighted ongoing differences in public charging pricing between states and territories, with energy costs and infrastructure rollout continuing to shape the overall ownership experience for Australian EV drivers.
Follow WhichCar/Wheels on Google
Click the button below to make WhichCar by Wheels a preferred source for your news.

We recommend
-
 News
NewsVFACTS March 2026: EV sales surge to record market share in March as demand accelerates
Battery electric vehicles account for 14.6 per cent of total sales amid fuel concerns and policy uncertainty.
-
 News
NewsEV roadblocks soften as market share increases... but more people would prefer to stick to petrol – report
The latest study into Australian attitudes towards EV ownership shows mixed results, with cost and range anxiety easier to swallow, but preferences for petrol on the increase.
