News

Gallery 1
It’s Census time so we thought we’d look away from the boring stuff like privacy, population, and whether you’re an observing Pastafarian for more important stats and facts about vehicles from the Australian Bureau of Statistics.
1
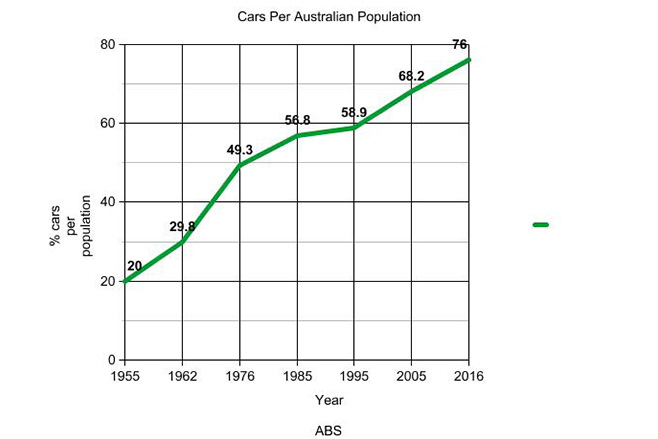
VEHICLES PER PEOPLE
It’s no surprise that the size of Australia’s “carpark” has risen steadily since 1955, but the rise is quite significant when put in terms of vehicles per capita. In 1955 there were 2,182,193 vehicles including “omnibuses, lorries and motorcycles”, which meant just 24 percent of the 9.2 million people surveyed by the census owned a car. By the beginning of 2016 there were 18,387,136 vehicles, meaning 76 out of every 100 Australians, on average, owned a car.
TOP 3 PASSENGER CAR BRANDS (NEW AND USED) BY REGISTRATION
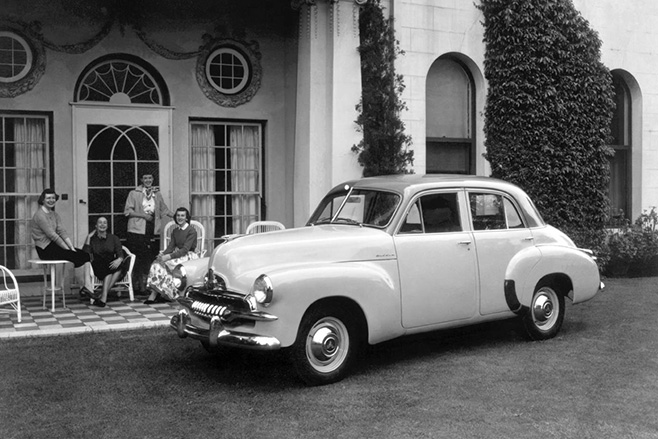
1955 Ford, Holden, Austin
Holden’s second place figure is noteworthy as it only includes 48-215 and FJ Holdens going back to 1948, as locally-sold GM cars such as Chevrolets and Vauxhalls were imported with their original badges intact. Meanwhile Ford’s numbers included local and international models from before 1930. Austin doesn’t include sister company Morris, which was fourth with 123,831.
1
1976 – Holden, Ford, Chrysler
In 1962 there were just seven Toyota passenger cars in Australia. By 1976 it was the fourth most registered brand with 314,657 cars on the road.
1995 – Ford, Holden, Toyota
By 1995 the Census only listed 21 significant car brands, compared to 74 in 1985.
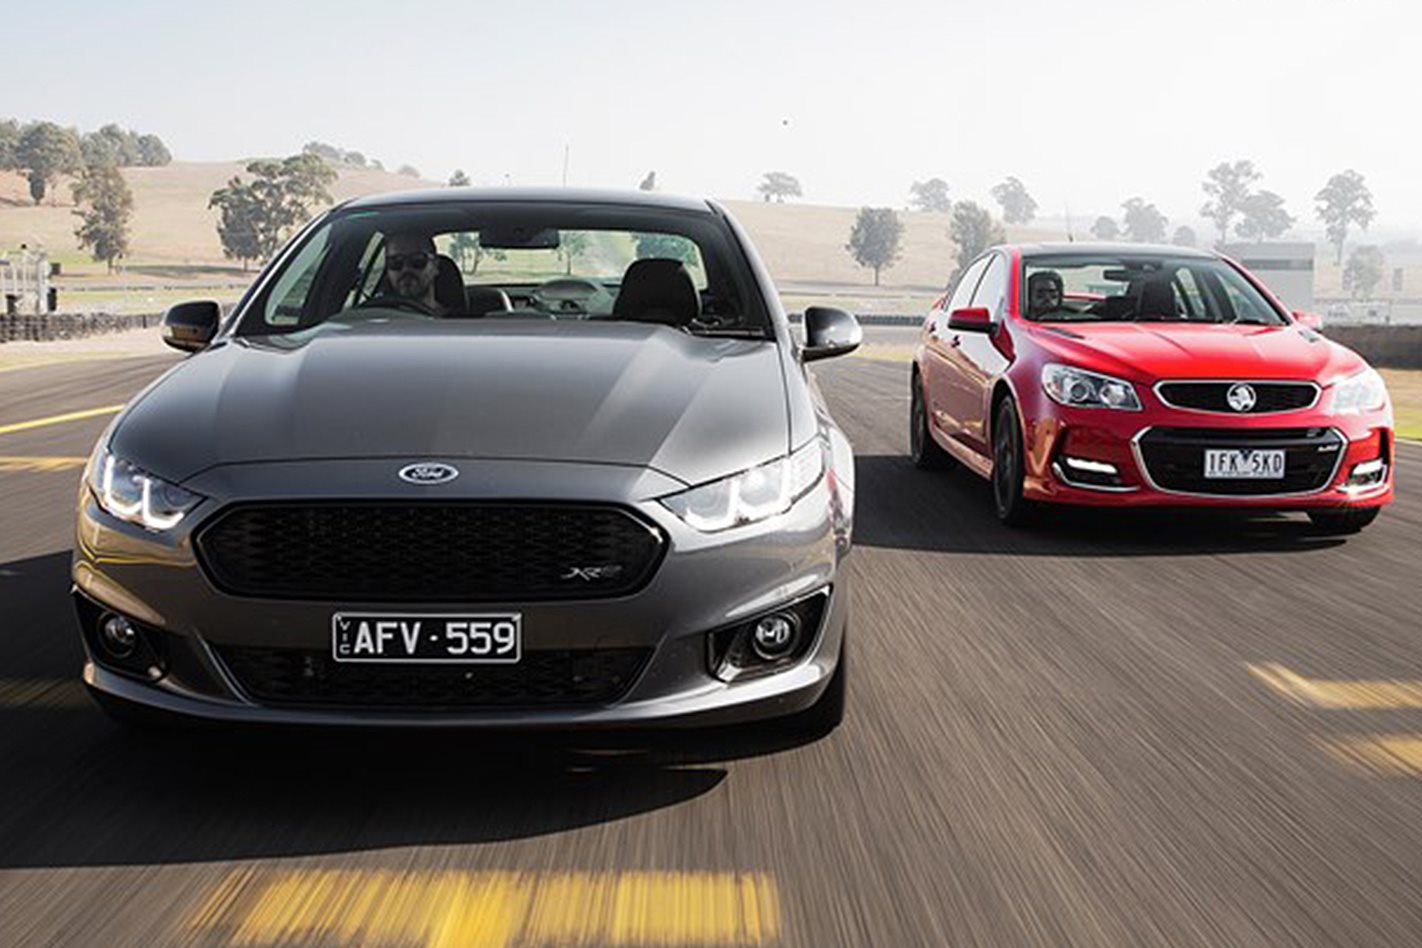
2016 – Toyota, Holden, Ford
Toyota’s dominance of the Australian market seems like it will last into the foreseeable future, but will this be the last time the top three includes both Ford and Holden?
ON THE BEATEN TRACK
1
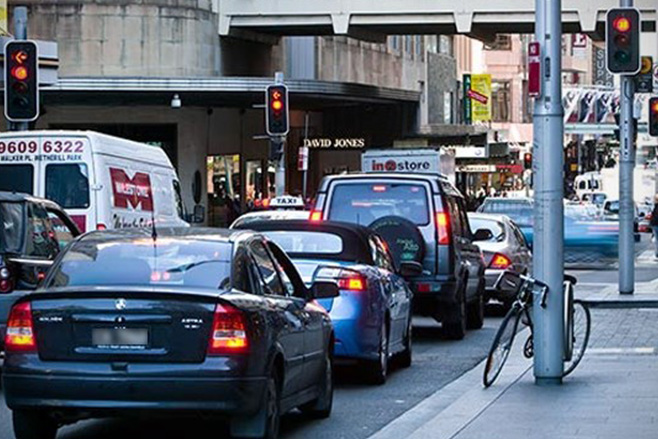
Motor vehicles of all types registered in Australia travelled an estimated 244,369 million kilometres in the 12 months prior to the 2014 census. This compares to 226,932 in 2010 and 209,405 in 2006.
Of the total kilometres travelled in 2014, more than 72 percent (176,805) were by passenger vehicles excluding buses.
Motor vehicles registered in Australia travelled an average of 13,800 kilometres per vehicle in the 12 months ended 31 October 2014. Victorian drivers travelled the highest average kilometres that year (14,500 kilometres). New South Wales (14,100) and Queensland (13,800) were also estimated to be above the national average, while vehicles registered in Tasmania travelled the lowest average kilometres (11,900).
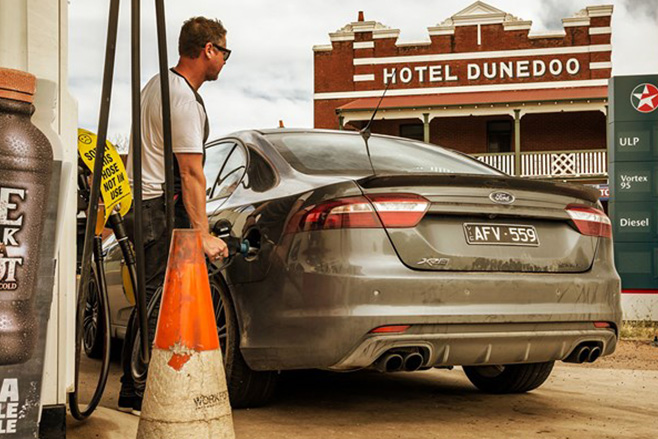
HARD EARNED THIRST
1
In the 12 months ended 31 October 2014, registered motor vehicles in Australia consumed an estimated 32,402 million litres of fuel. Of the total fuel consumed by motor vehicles in 2014, 54 percent was petrol and 40.5 percent was diesel.
Passenger vehicles consumed 18,893 million litres in this time, of which 80.6 per cent (15,234 million litres) was petrol.
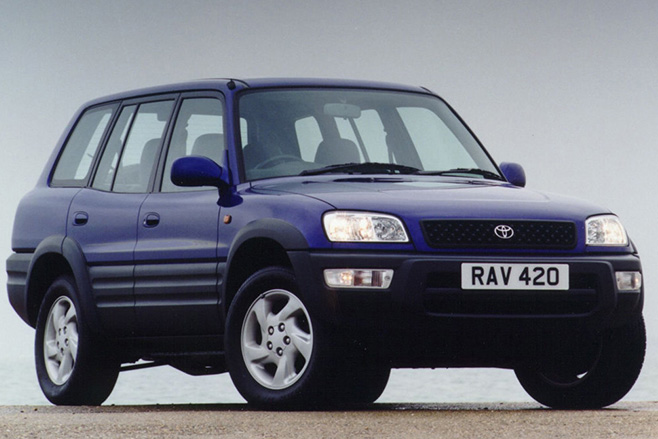
THE RISE OF THE SUV
1
In January 1994 there were 2996 SUVs sold, representing 8.42 per cent of the market. This has grown steadily, to 18.93 per cent (13,251) in January 2006 and 35.8 per cent (46,011) at the start of this year.
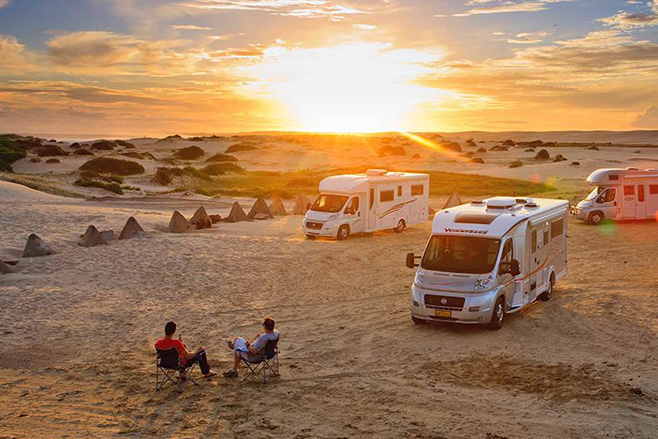
THE GREY NOMADS MOBILISE
1
Next time you go on a driving holiday you may want to leave a little earlier. Recreational vehicles (RVs) reported the largest growth rate of any vehicle type, increasing by 4.5 per cent according to ABS figures released at the start of 2016. That number included 58,375 campervans and 528,210 caravans.
Follow WhichCar/Wheels on Google
Click the button below to make WhichCar by Wheels a preferred source for your news.