News
Gallery 1
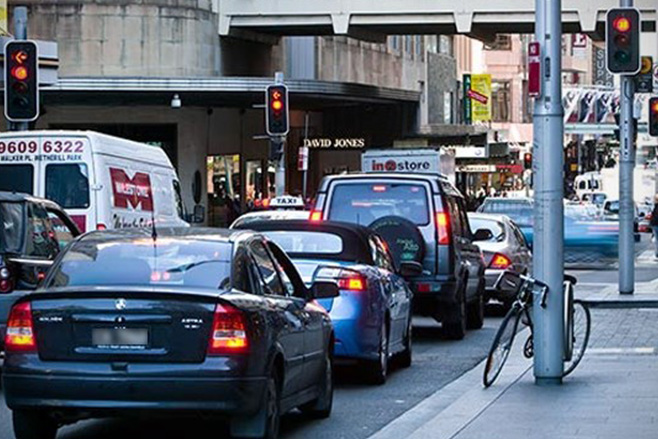
If you want an easy life on the road then head to Darwin. Australia’s northern outpost has just ranked best for traffic congestion, ahead of Wollongong and Canberra, in a global gridlock rating.
Commuters only suffer a 25 per cent peak-hour delay in Darwin, compared with 75.9 per cent in Mexico City, which was the worst performer in the worldwide TomTom Traffic Index results for 2025.
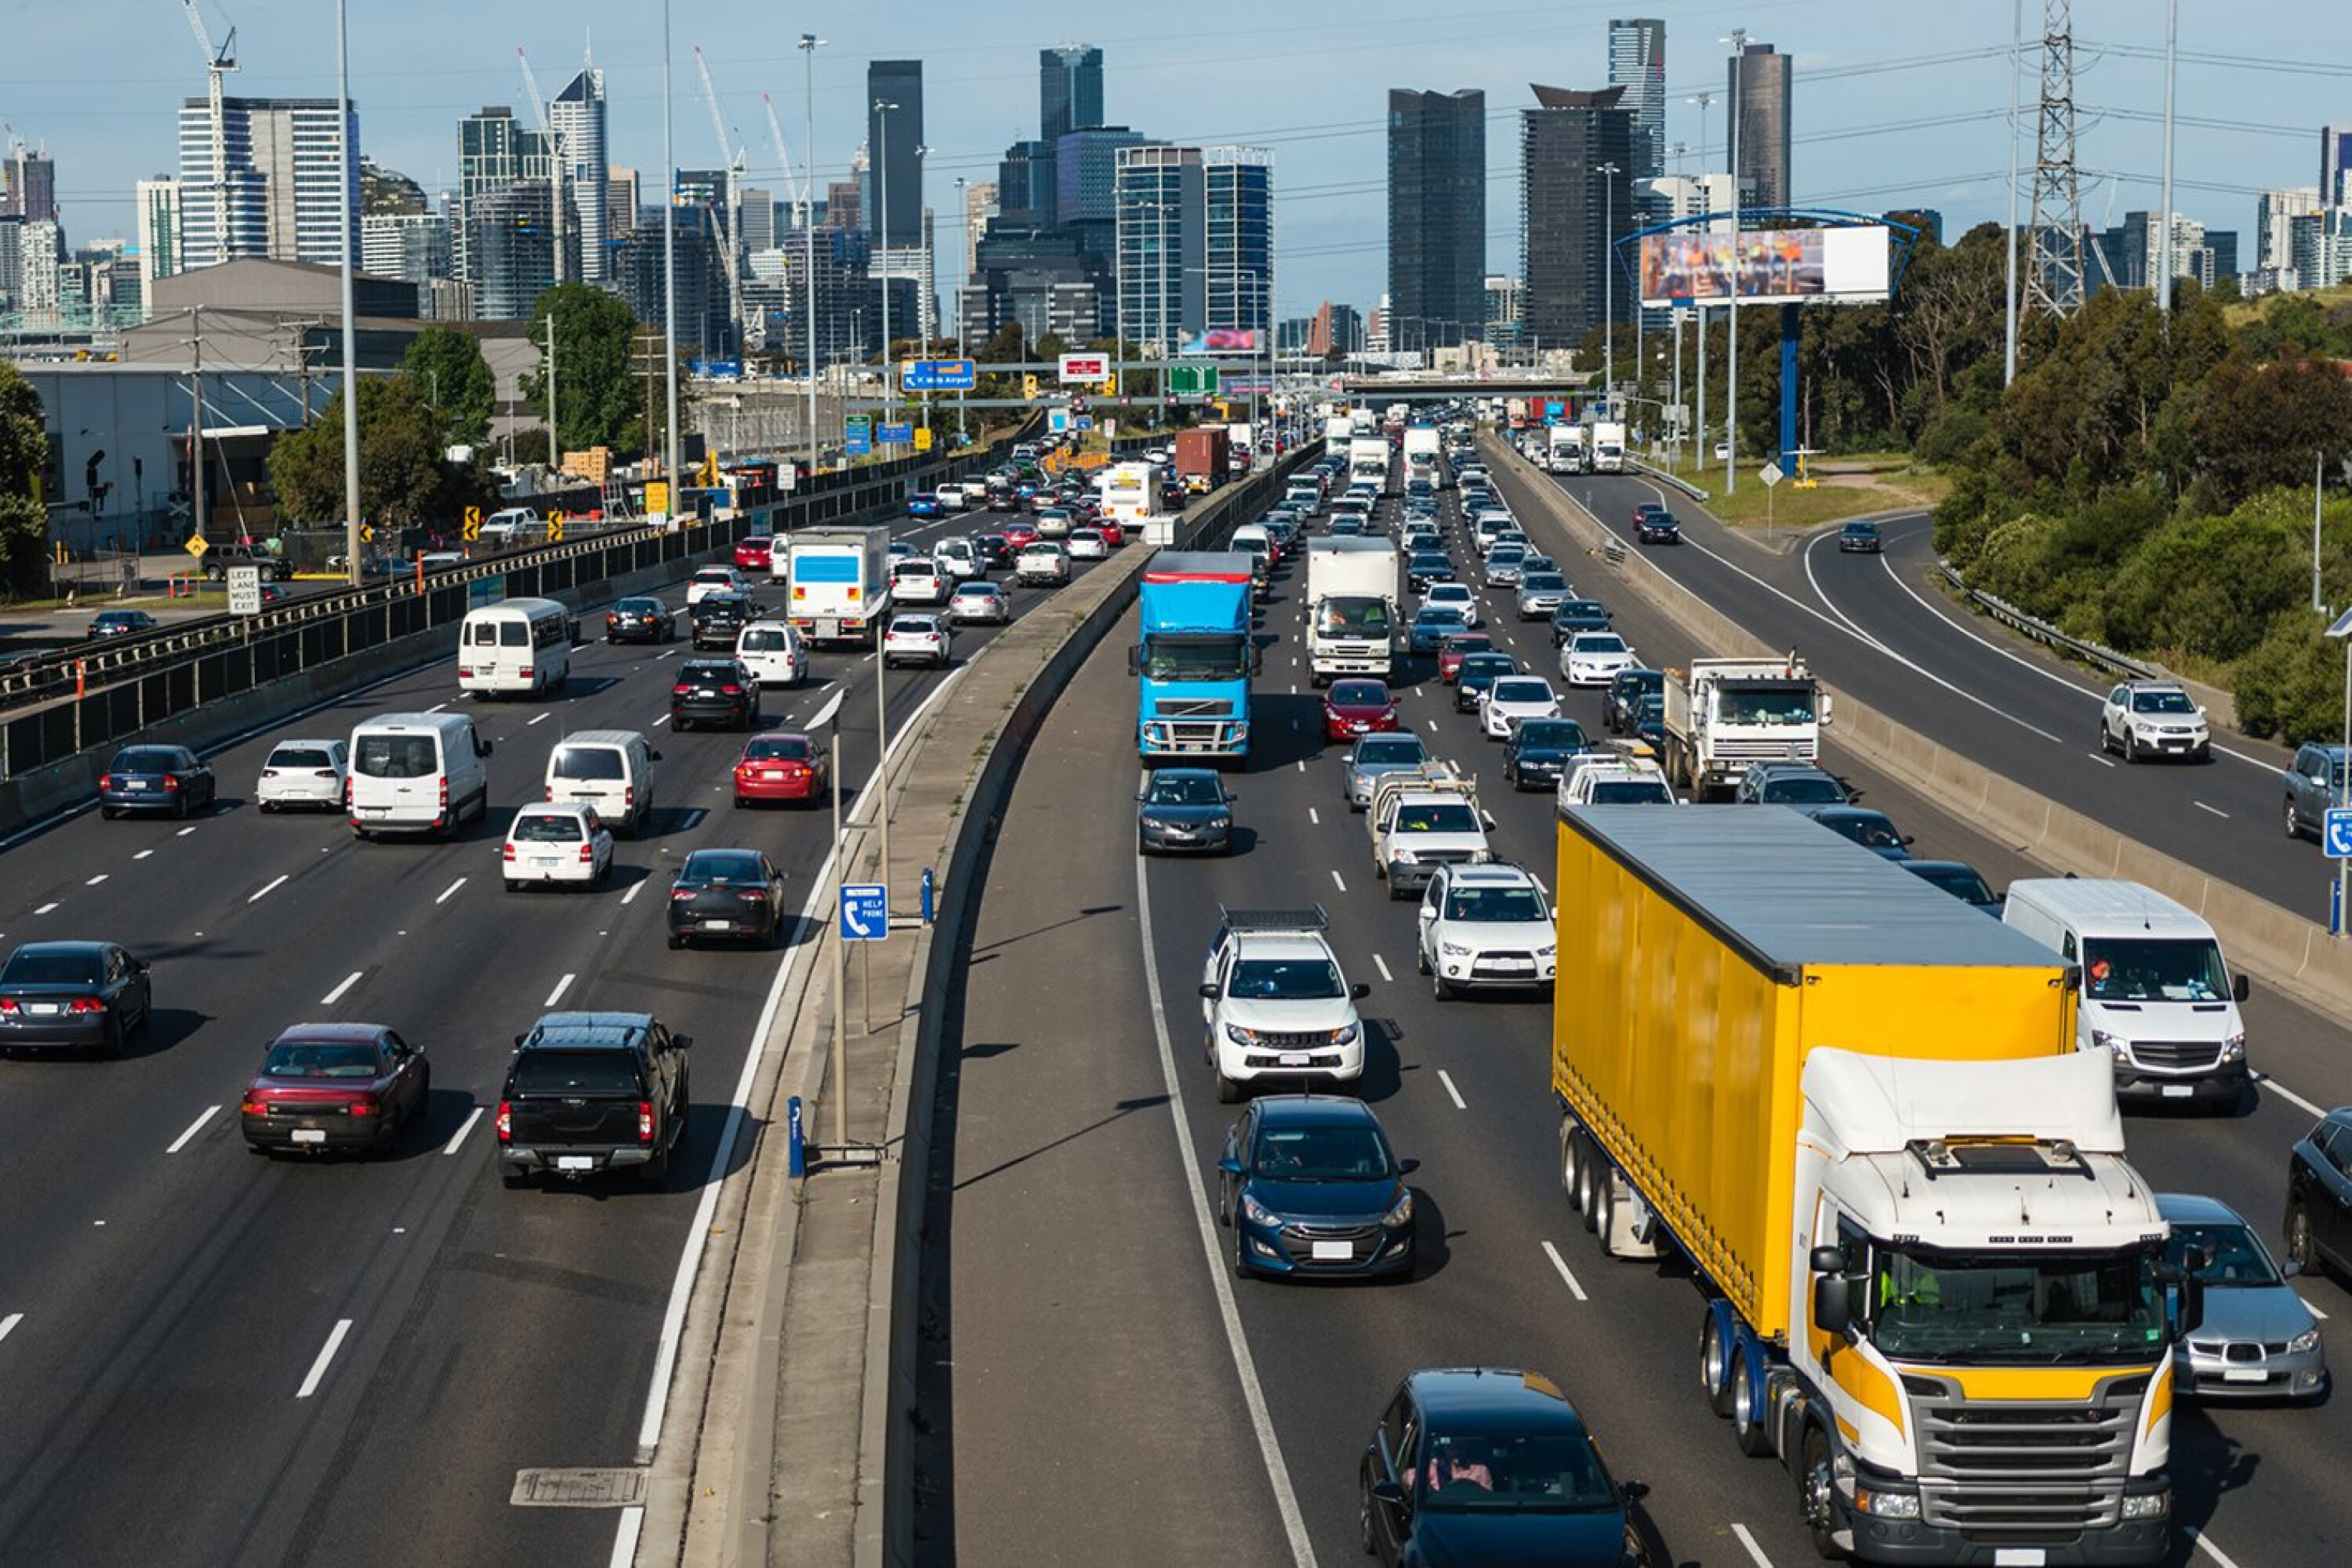
Adelaide has the worst traffic in Australia, according to TomTom, ahead of Melbourne, Gold Coast and Sydney.
It’s the 15th year TomTom has surveyed traffic delays, measuring how much traffic slows down on a road network compared with ideal free-flow travel times, expressed as a percentage.

1
Brisbane was the only Australia city to have an improvement in its performance, as 466 of 500 cities went backwards in 2025, although it only improved by one per cent.
“For another year, it shows just how universal vehicular congestion is,” TomTom said. “Major cities experienced increased travel times, including, London, England; Bengaluru, India; Dublin, Ireland; Mexico City, Mexico; Barcelona, Spain; Athens, Greece; Milan, Italy; Rosario, Argentina; Hiroshima, Japan; San Francisco, United States; and many others.
“It would be significantly quicker to list the cities where travel times have improved and decreased compared to 2024. Of the nearly 500 cities reviewed in 2025, just 34 saw reductions in their inner-city travel times per kilometre compared to a year earlier.”
Adelaide had a 55.1 per cent rating from TomTom, which meant drivers spent 109 hours in rush-hour delays each year, as it was ranked 50th overall. It finished just ahead of Melbourne at 52.9 per cent, then Gold Coast, Sydney and Newcastle. Globally, Mexico City was rated at 75.9 per cent, ahead of the Indian city of Bengaluru, then Dublin in Ireland.
1
TomTom Traffic Index 2025
1. Mexico City, Mexico, 75.9%
2. Bengalaru, India, 74.4%
3. Dublin, Ireland, 72.9%
4. Lodz, Poland, 72.8%
5. Pune, India, 71.1%
6. Lublin, Poland, 70.4%
7. Bogota, Columbia, 69.6%
8. Arequipa, Peru, 69.5%
9. Lima, Peru, 69.3%
10. Bangkok, Thailand, 67.9%
Australian cities
50. Adelaide, 55.1%
64. Melbourne, 52.9%
106. Gold Coast, 48.6%
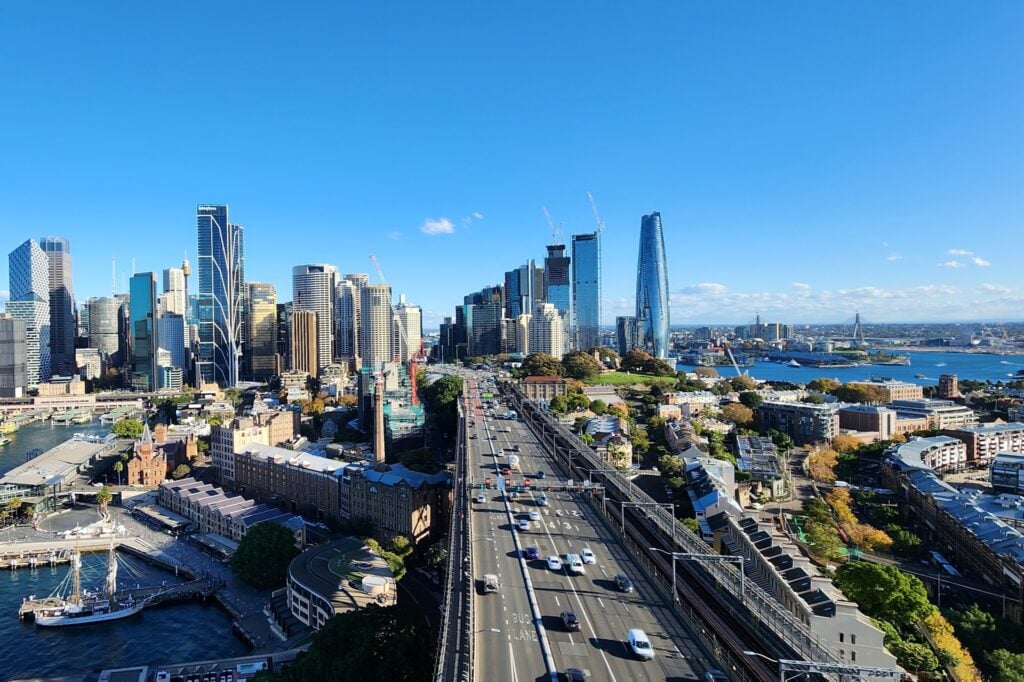
166. Sydney, 43.7%’
206. Newcastle, 41.3%
222. Brisbane, 40.5%
255. Hobart, 38.2%
303. Perth, 35.9%
348. Canberra, 33.6%
374. Wollongong, 31.8%
426. Darwin, 27.5%
Follow WhichCar/Wheels on Google
Click the button below to make WhichCar by Wheels a preferred source for your news.
We recommend
-
 News
NewsRevealed: Car brands that Aussies are most likely to buy again
New research reveals that 65 per cent of Australians would likely buy their current car brand and model again when intending to buy a new car.
-
 News
NewsAussies name their biggest regrets when it comes to car dealership 'add-ons'
New survey shows many Australians feel dealership extras don’t deliver value.