News

Gallery 1
Ford “almost pulled out of Australia” at an undisclosed period in recent years, it has been revealed.
Ford Authority [↗] reports Ford CEO Jim Farley said at a recent industry conference that the brand once considered leaving Australia – like once arch-rival Holden did in 2020 – following similar moves in Brazil and India.
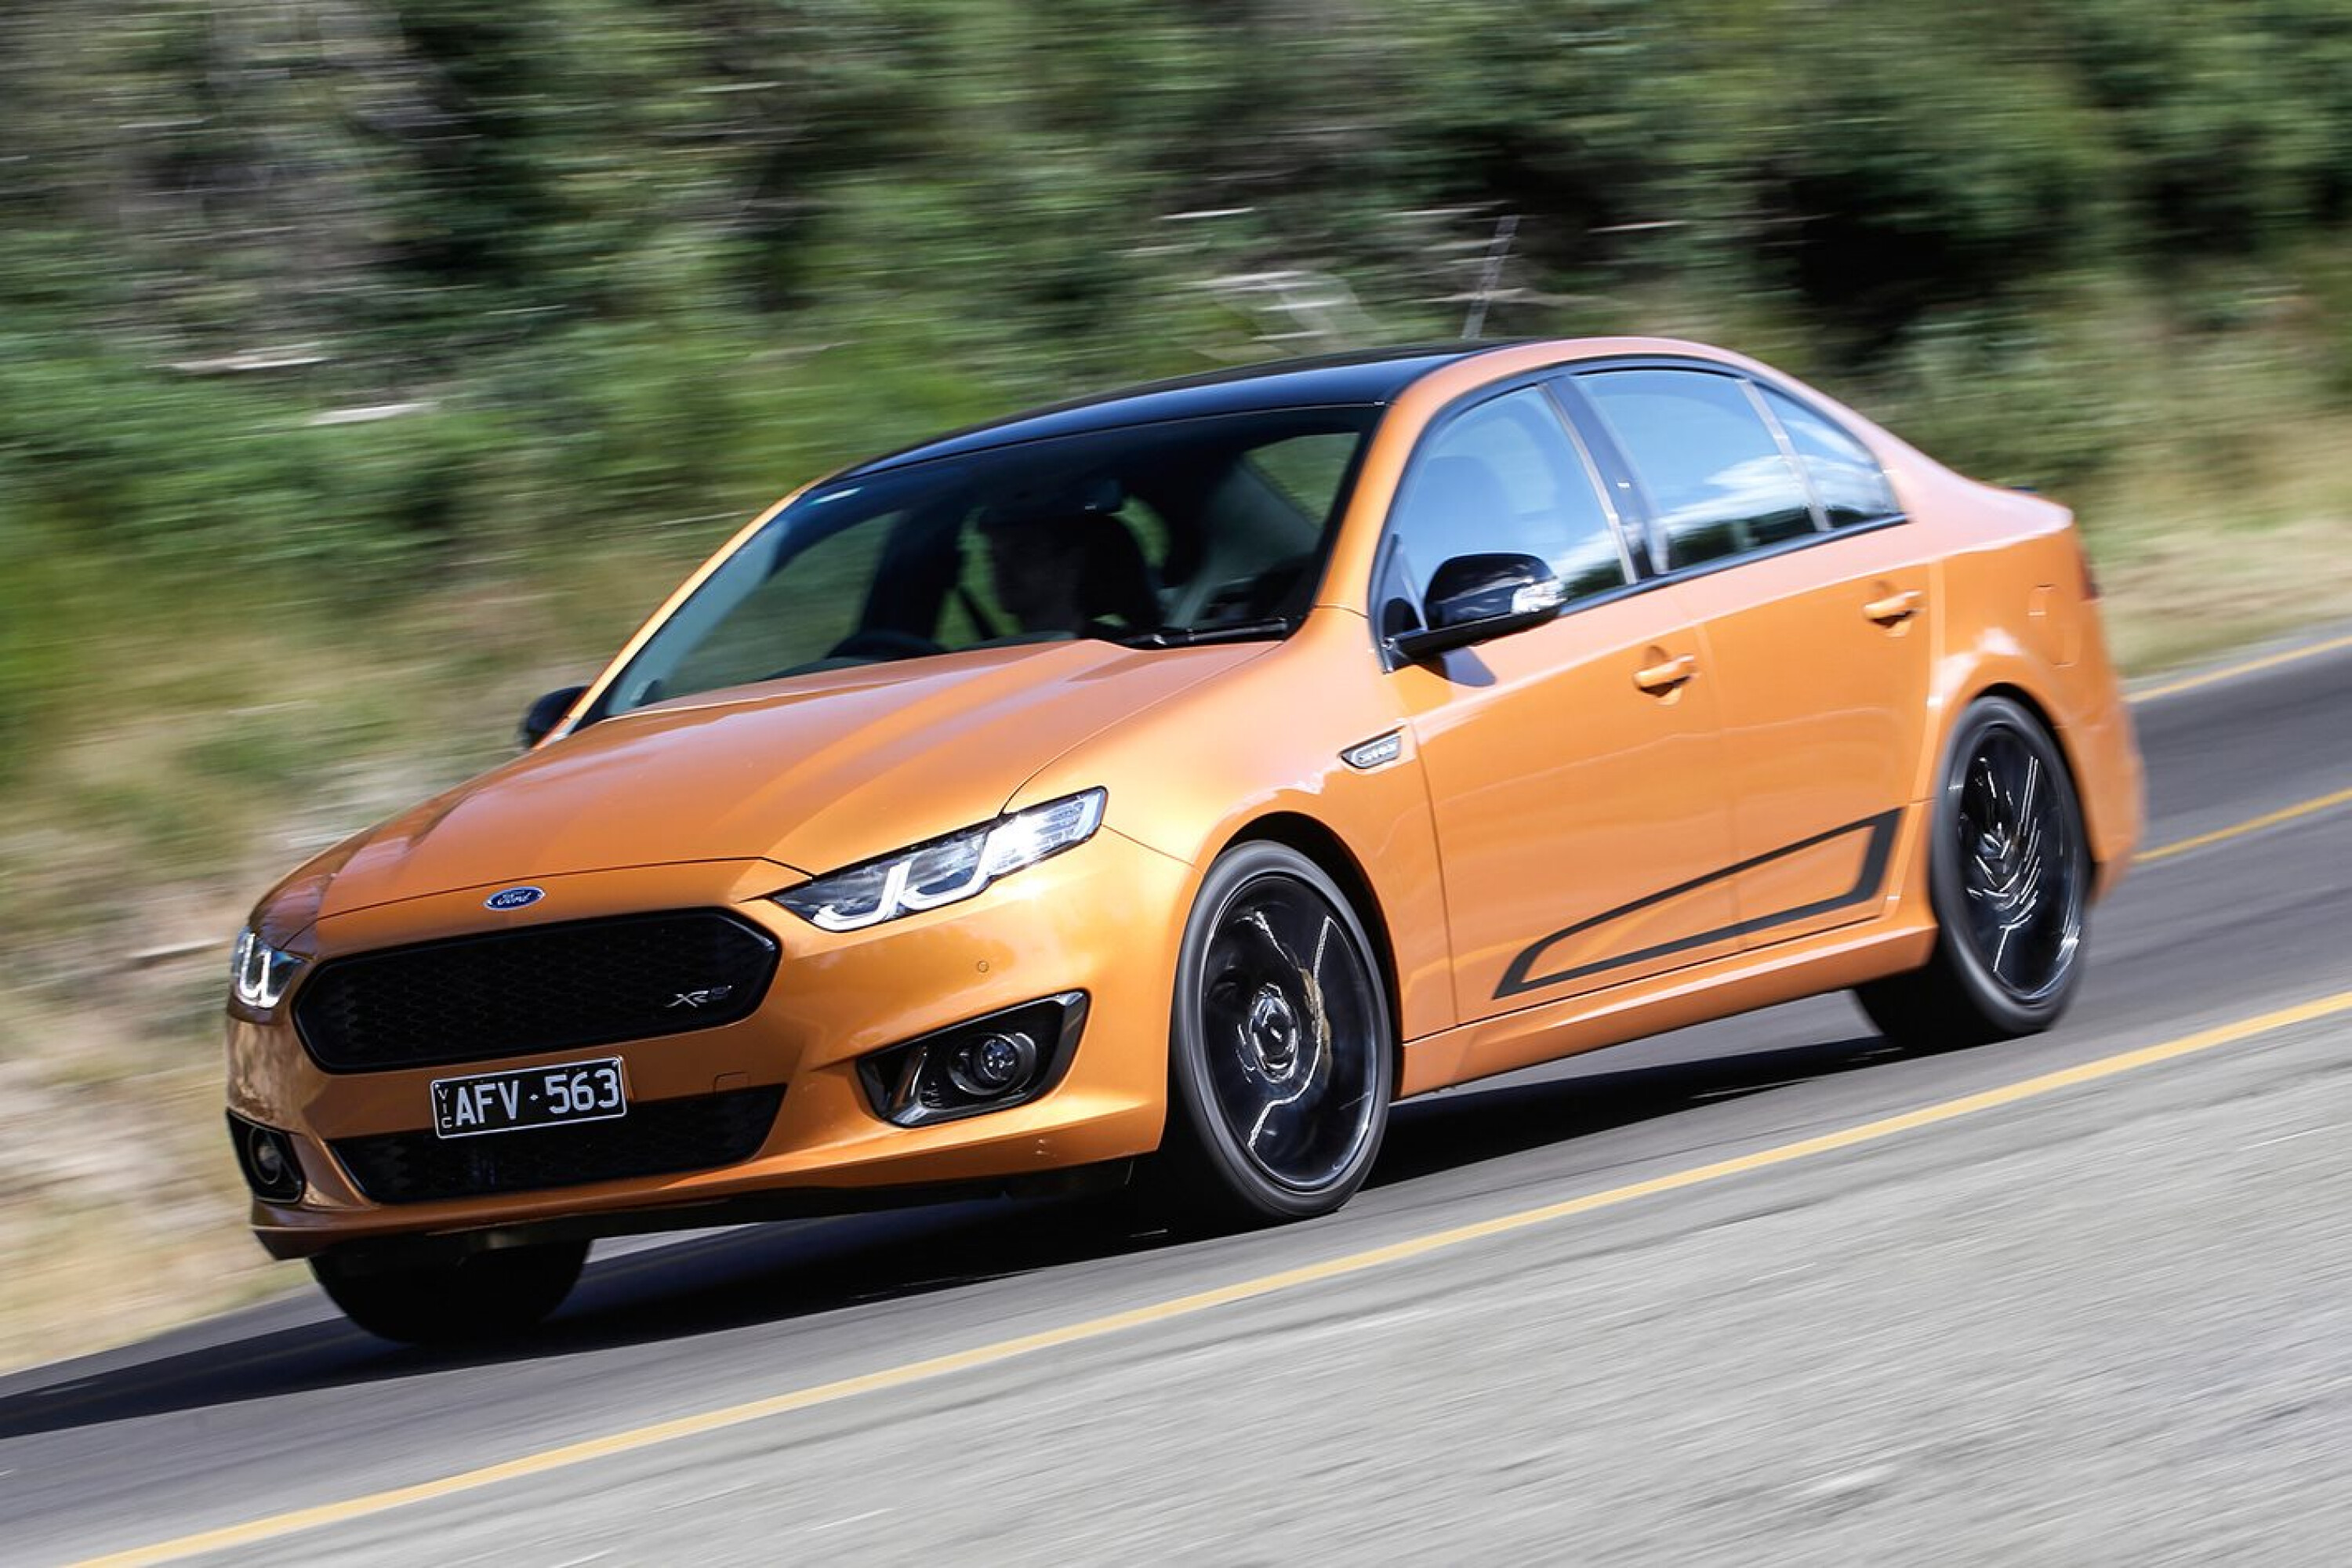
It is unclear when Ford bosses in Detroit were considering shutting down the Australian operation, but it was likely around the time local Falcon and Territory production ended in 2016 – before sales of the Ranger ute steadily rose to eventually become Australia’s top-selling vehicle in 2023.
“We don’t really talk about Ford anymore overseas, but we should because our Pro business is very profitable in Europe now,” said Farley. “We have a very small footprint in China. So, we’re totally unique among the other OEMs. Not a lot of risk, not a lot of reward, but we have a very profitable Ranger business. People wouldn’t realise this.”
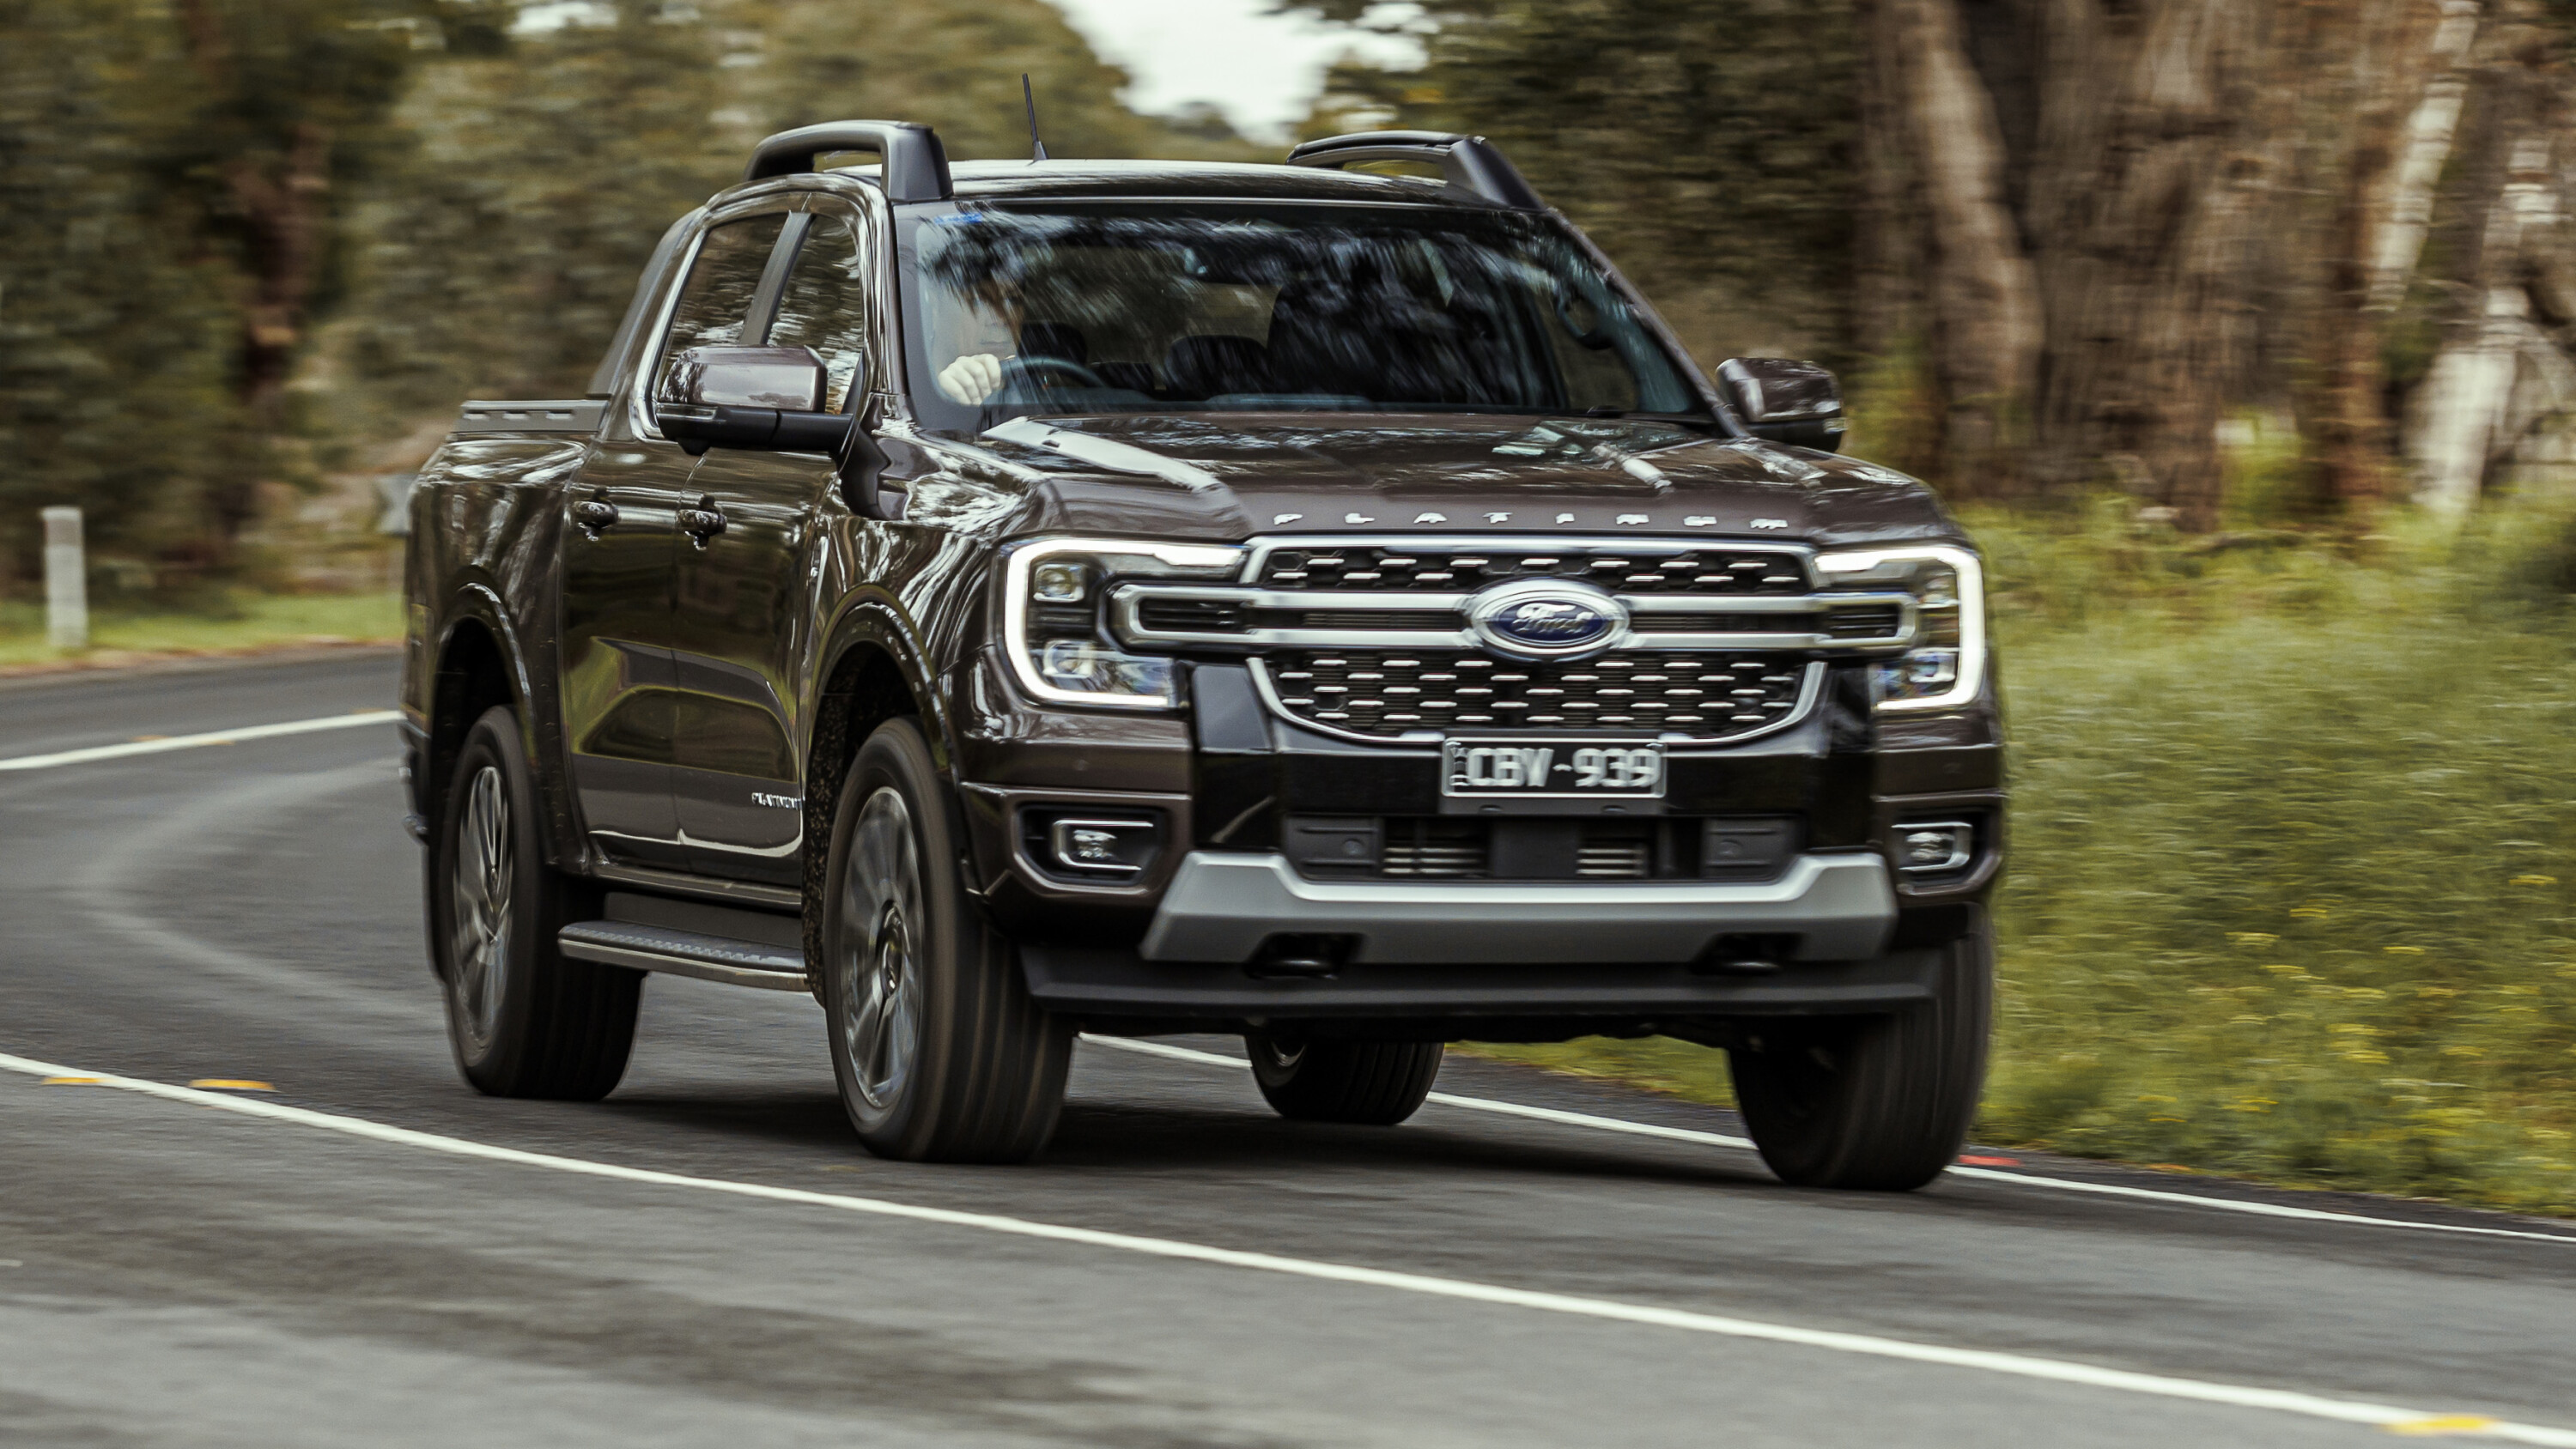
“The second highest volume vehicle at Ford is Ranger. Ranger globally outsells Super Duty. We are now number two in pickups outside of the U.S. and pickups are growing big time. We sell 5000 Raptors in China for US$150,000 each, and we’re the best-selling vehicle in Australia. We almost pulled out of Australia.
“The Ranger is number one in South Africa, huge pickup market. We’re number one in pickups in Europe. The Ranger is growing and super profitable in South America. It is our only vehicle in South America.”
1
In 2016, Ford Australia sold 81,207 vehicles with a 6.9 per cent market share before falling to 59,601 in COVID-affected 2020 with a 6.5 per cent market share.
In 2023, Ford sold 87,200 cars in Australia – mostly Rangers and Everests – with a 7.2 per cent market share, which was its best result since 2012.
Former Ford Australia boss Graeme Whickman told Wheels in a 2016 interview that the brand had been “in decline” and its “reliance on certain products had been obvious to everybody as it is with Holden [with Commodore]”.
In its shift from a local manufacturer to a full importer, Ford Australia promised a better customer experience, better dealer relations, fewer fleet sales, removing loss-leader models from its line-up, and rejecting volume for volume’s sake. It introduced a five-year/unlimited-kilometre warranty in mid-2018.
It also invested significantly in improving its local facilities, which were used to develop the latest Ranger and Everest – as well as its Volkswagen Amarok twin-under-the-skin – introduced in 2022.
However, Ford Australia ended around 120 contract roles in its development and design teams in 2022, along with a further 250 engineering jobs in 2019.
Ford Australia recently discontinued the internal-combustion Puma small SUV and Escape midsize SUV, but it will soon offer an all-electric version of the Puma known as the Gen-E.
It also axed the Focus ST and Fiesta ST hot hatches in 2022, following the deletion of standard Focus variants and the slow-selling, diesel-only Endura large SUV in 2020.
Ford has introduced the Mustang Mach-E, E-Transit and E-Transit Custom electric cars in Australia, while the segment-first Ranger Plug-In Hybrid will arrive in early 2025. The full-size F-150 ute – converted from left- to right-hand drive in Melbourne – was re-introduced in late 2023.
Additionally, the latest-generation Mustang sports car is due here soon, while the Tourneo – a people-mover version of the Transit Custom commercial van – will be introduced in Australia later this year.
1
Ford sales in Australia
| Year | Ford sales in Australia | Ford market share in Australia |
|---|---|---|
| 2000 | 113,810 | 14.5 per cent |
| 2001 | 106,730 | 13.8 per cent |
| 2002 | 109,194 | 13.2 per cent |
| 2003 | 126,581 | 13.9 per cent |
| 2004 | 135,172 | 14.2 per cent |
| 2005 | 129,140 | 13.1 per cent |
| 2006 | 114,965 | 11.9 per cent |
| 2007 | 108,071 | 10.3 per cent |
| 2008 | 104,715 | 10.3 per cent |
| 2009 | 96,501 | 10.3 per cent |
| 2010 | 95,284 | 9.2 per cent |
| 2011 | 91,243 | 9.0 per cent |
| 2012 | 90,408 | 8.1 per cent |
| 2013 | 87,236 | 7.7 per cent |
| 2014 | 79,703 | 7.2 per cent |
| 2015 | 70,454 | 6.1 per cent |
| 2016 | 81,207 | 6.9 per cent |
| 2017 | 78,161 | 6.6 per cent |
| 2018 | 69,081 | 6.0 per cent |
| 2019 | 63,303 | 6.0 per cent |
| 2020 | 59,601 | 6.5 per cent |
| 2021 | 71,380 | 6.8 per cent |
| 2022 | 66,628 | 6.2 per cent |
| 2023 | 87,800 | 7.2 per cent |
MORE
Everything Ford
Follow WhichCar/Wheels on Google
Click the button below to make WhichCar by Wheels a preferred source for your news.