
News

Gallery 1
Australia’s discussion about road safety is singular in its tone. Across the nation state governments and police forces are working on a plan dubbed Toward Zero – with the goal of reducing the number of deaths on our roads to nil.
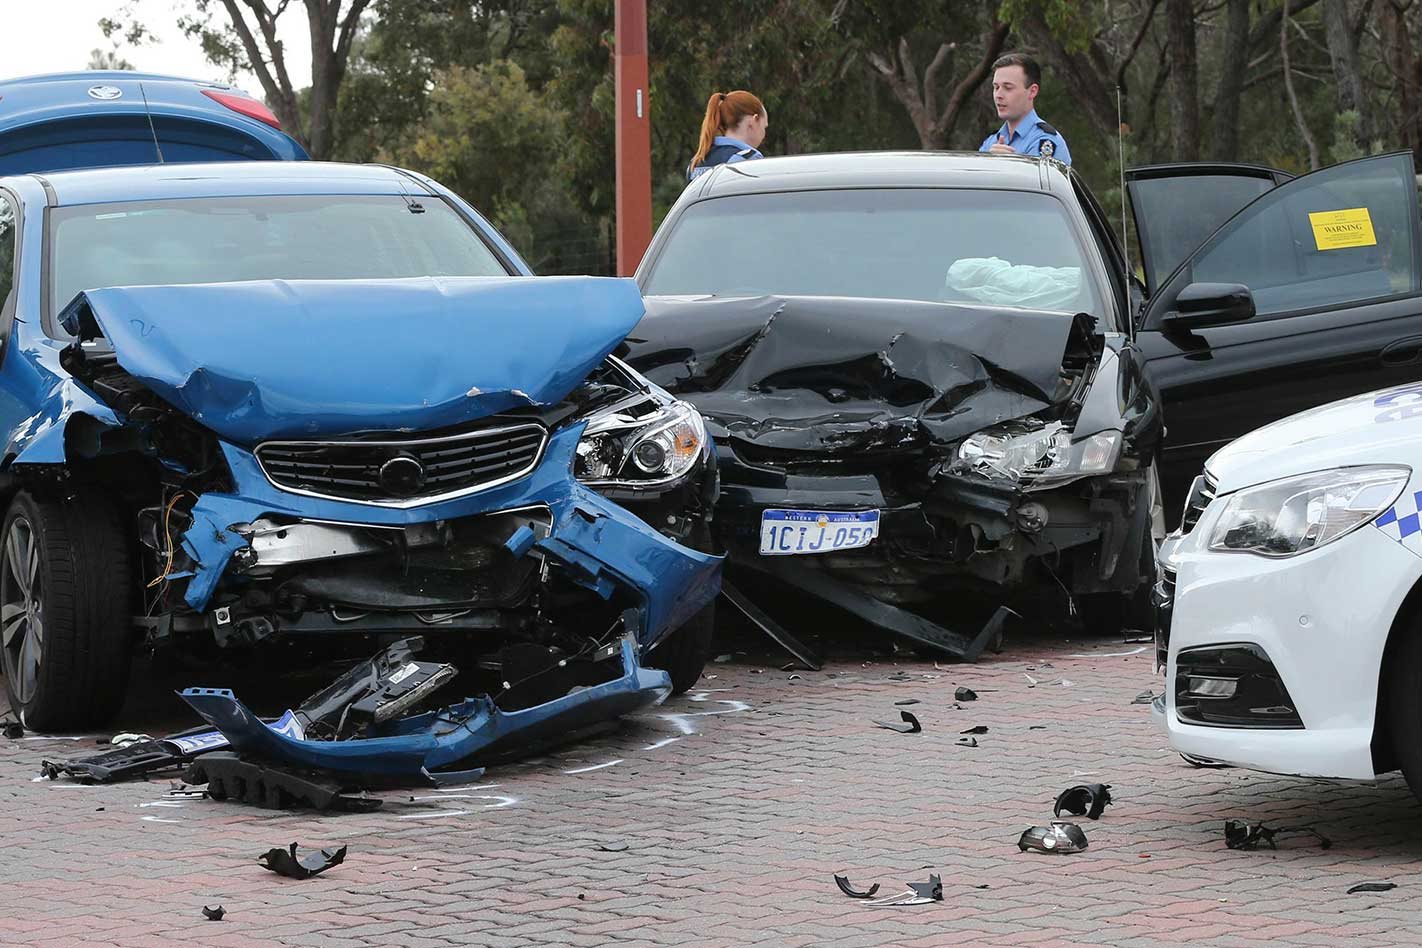
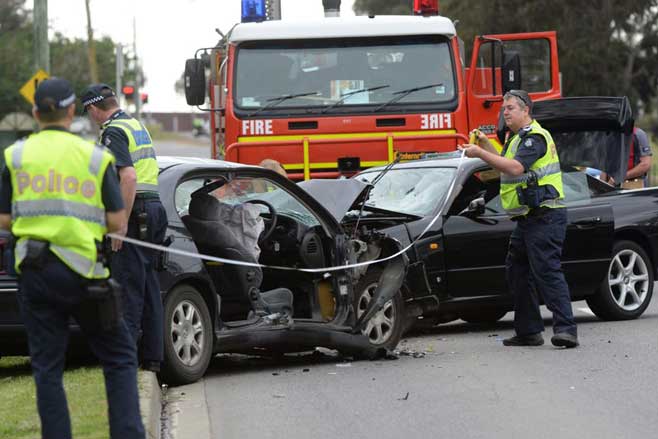
Admirable, though improbably difficult, as it may be, Toward Zero’s focus on deaths is taking focus away from a worrying trend that is emerging. More Australians are being injured on our roads every year, and a significant portion of those pose a ‘high threat to life’.
1
In Victoria alone, between 2013 and 2019, hospitalisations from a result of traffic crashes have risen 38 percent. In the same period the road toll fell 12.3 percent.
According to the latest annual road trauma statistical summary, released by the federal Department of Infrastructure, Transport, Cities and Regional Development, injuries on the road have risen nationally for the last decade, while fatalities have fallen in the same period
It states that in 2016 the rate of hospitalised injuries per 100,000 people was 35 times the fatality rate. Traffic crashes are the second highest cause of hospitalisations in Australia, accounting for 12 percent, behind falls (41 percent).
The 38,945 hospitalisations across the country in 2016 represent a nominal increase of 3.6 percent each year since 2015.
1
Released last year, the report only has data on hospitalisations up to 2016, and it states this data set is only comparable with 2013 due to a break in records on July 1, 2012.
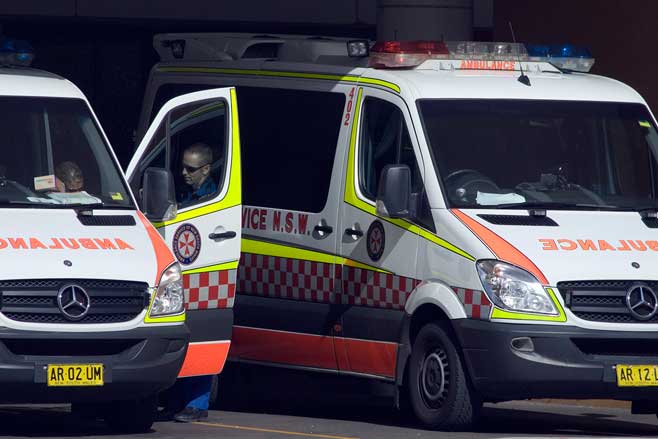
The TAC keeps a record of both fatalities and hospitalisations in Victoria, with a six-month lag in reporting, meaning 2018 is the last complete year available.
Last year 8636 hospitalisations occurred as a result of traffic incidents, compared to 213 fatalities. In 2013 those numbers were 6252 and 243 respectively.
Interestingly, there’s a disparity in geographic location when comparing deaths and hospitalisations on Australian roads. According to 2018 national road trauma statistics, almost two thirds of road deaths occur in regional and remote areas, while about two thirds of hospitalisations occur in major cities.
While the reason for the rapid rise in hospitalisations is unclear, it could be attributed to the improving safety of modern cars.
A quarter of national hospitalisations from traffic incidents result in ‘high threat to life’ injuries, while in Victoria the number of stays in hospital over 14 days has grown steadily.
The numbers should be a wake-up call for everyone who believe the number of deaths on our road each year is the only measure of success when it comes to measuring driver safety in Australia.
Victorian road fatalities vs hospitalisations (2013-18):
| Year | Fatalities | Hospitalisations |
| 2018 | 213 | 8636 |
| 2017 | 259 | 8471 |
| 2016 | 290 | 7745 |
| 2015 | 252 | 6841 |
| 2014 | 248 | 6459 |
| 2013 | 243 | 6252 |
| 6-year average | 250 | 7400 |
| 6-year increase | -12.3% (-30) | 38.1% (+2384) |
Follow WhichCar/Wheels on Google
Click the button below to make WhichCar by Wheels a preferred source for your news.