Features

Gallery 1
In response to an earlier article regarding Australia’s road safety problem, a number of commentators mentioned it would have been good to see more data in the piece.
Worried a numbers-heavy piece would make the piece more difficult to read and distract from the main message of driver education, I tried to keep the figures to a minimum. However, there is certainly value in a greater investigation into road safety data, so you’ll find that below.
1
My main source for the article was the Australian Infrastructure Statistics Yearbook 2017, compiled by the Australian Bureau of Infrastructure, Transport and Regional Economics, part of the Department of Infrastructure and Regional Development.
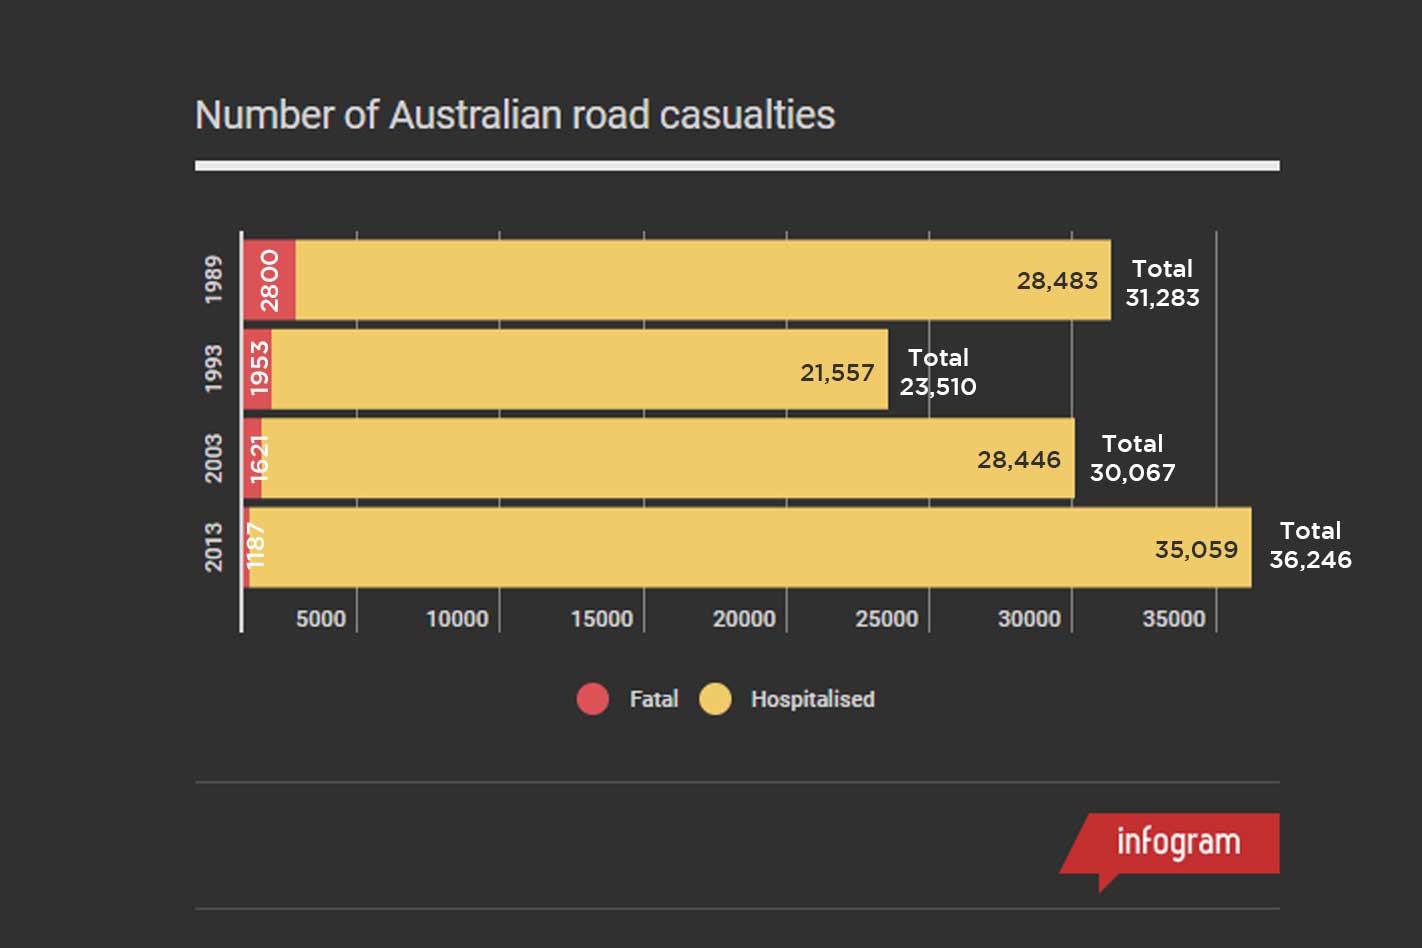
One of the key points in the original article is that while Australia’s road fatality rate has fallen dramatically over the decades, the injury rate has actually risen. While fatal crash data goes back to 1973, hospitalisation data only began being recorded in 1989, making that the first year available for comparison.
Nonetheless, you can find the absolute figures below:
Table 1. Number of road casualties
1
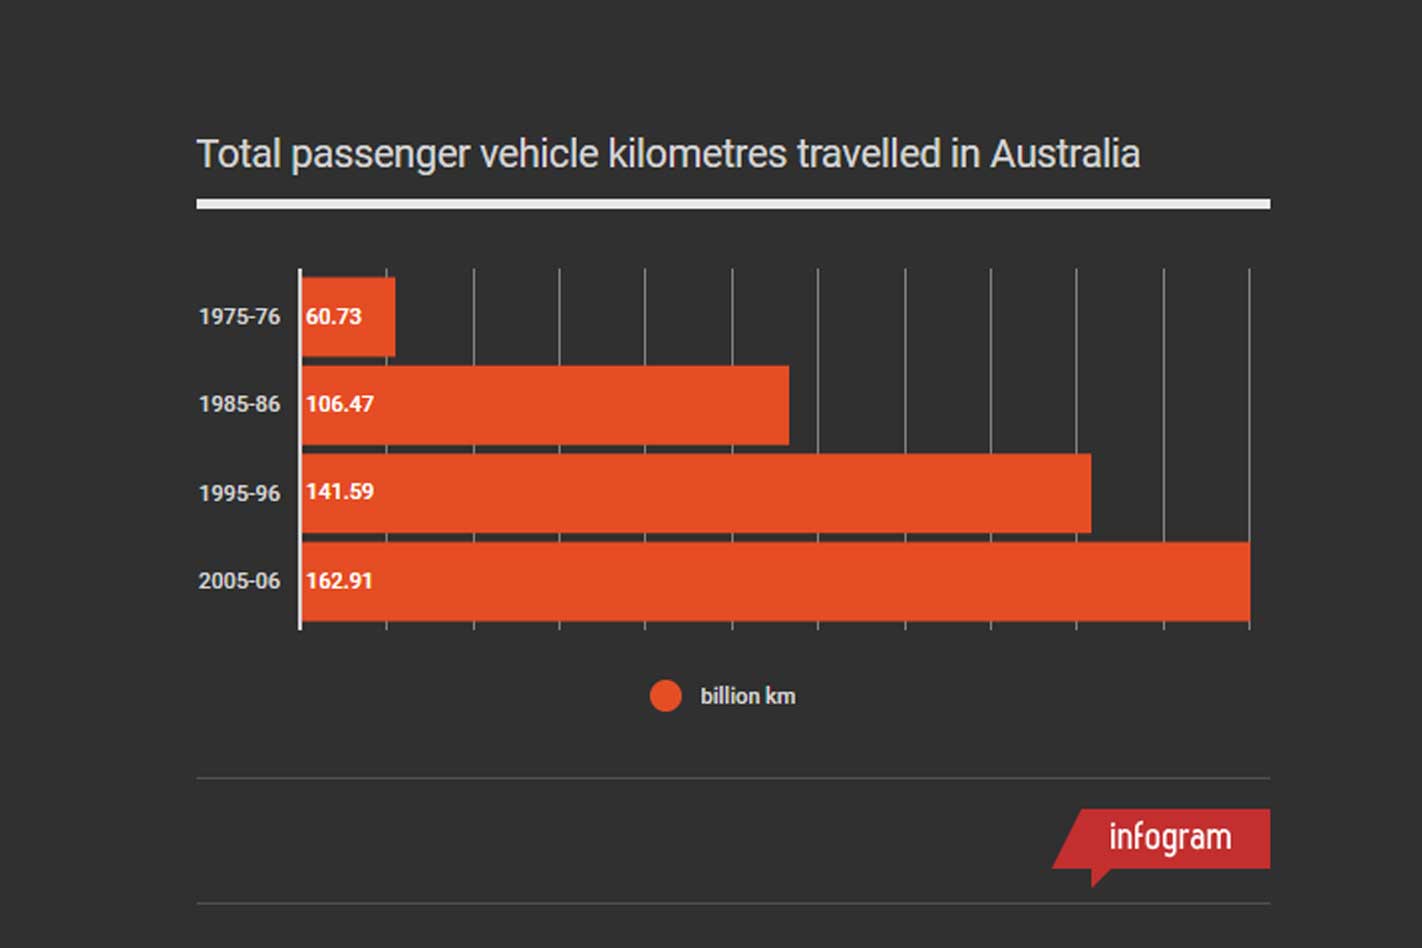
As a few people pointed out, these figures don’t tell the whole story, as there are a lot more cars on the road in 2013 than in 1989, therefore the number of total crashes is likely to increase. Below is the total number of kilometres travelled by Australian motorists by passenger cars over the decades.
Table 2. Total vehicle kilometres travelled (passenger cars)
1
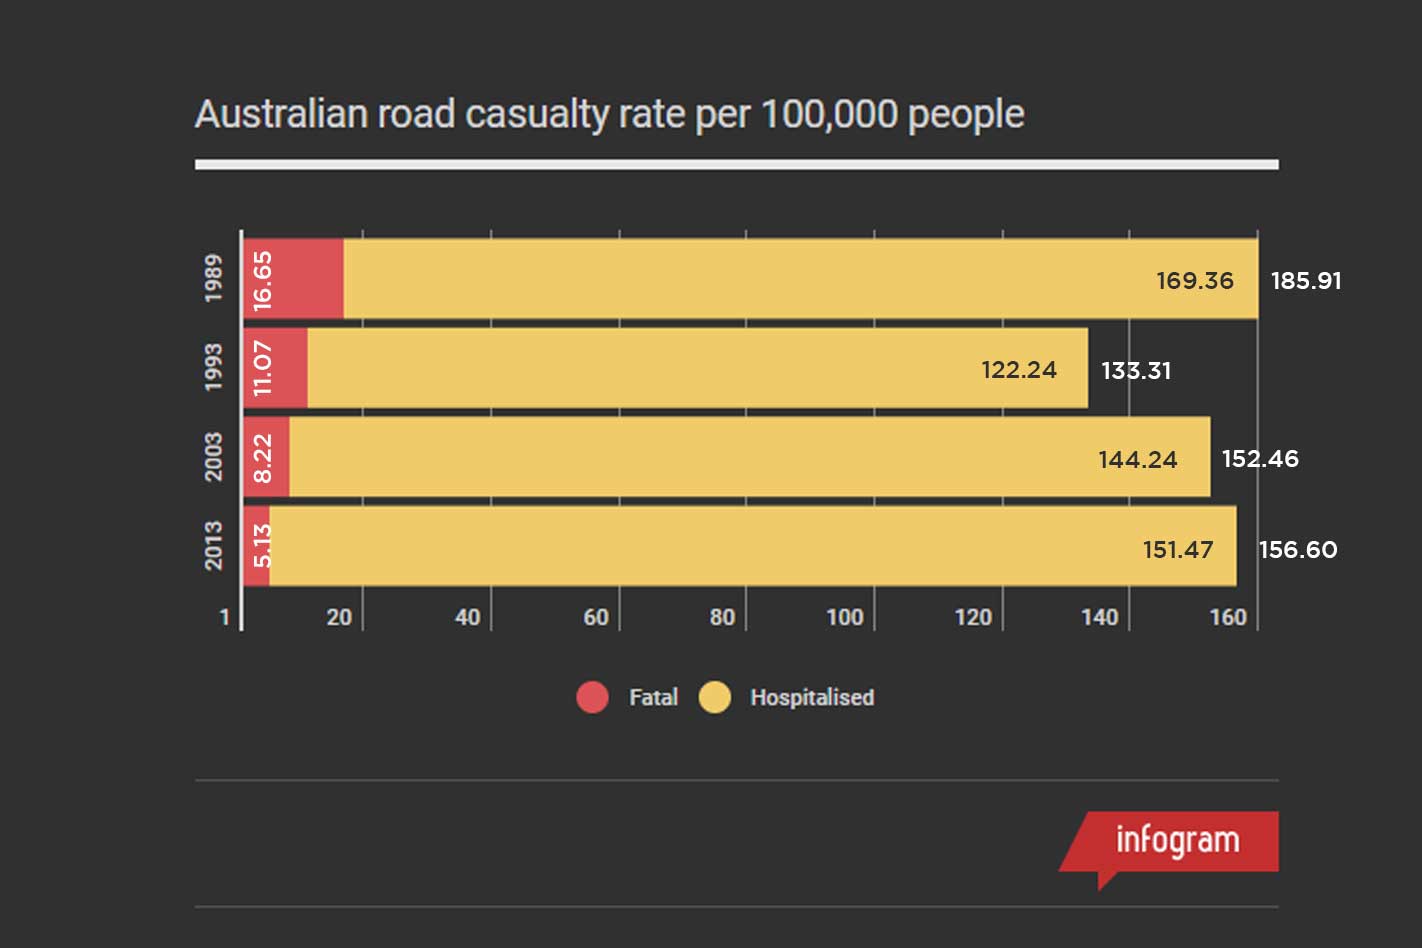
However, regardless of the metric used, the results are the same. Below is Table 1 but divided per 100,000 population at the time.
Table 3. Road casualty rate per 100,000 people
1
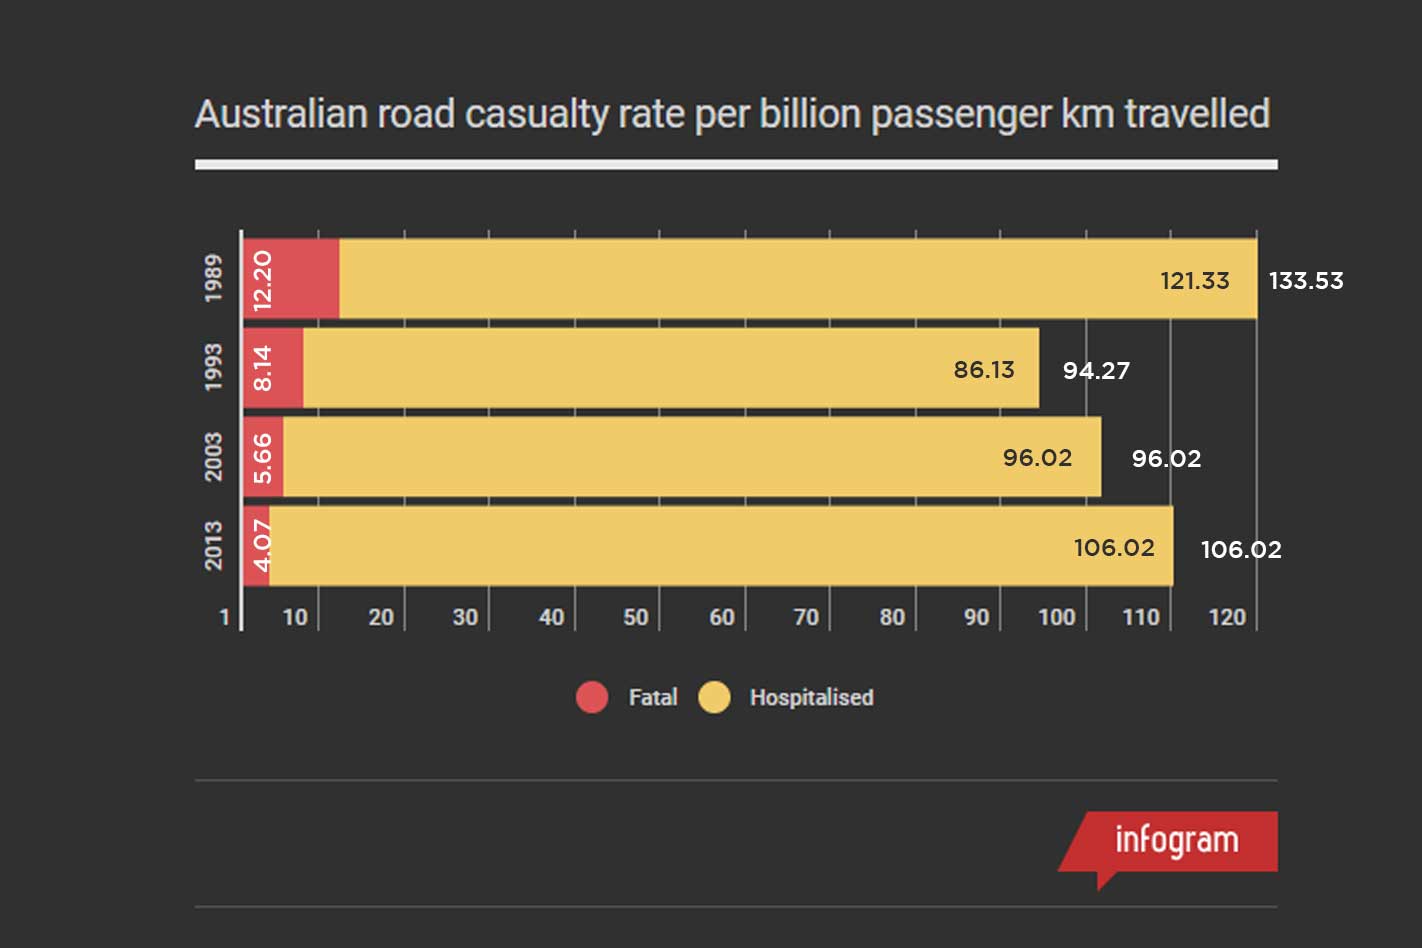
Below are again the same figures from Table 1, this time divided per billion passenger kilometres travelled.
Table 4. Road casualty rate per billion passenger km travelled
1
As you can see, Australia has had a dramatic reduction in the number of road fatalities, but the number of serious crashes (ones that result in hospitalisation) has increased. This suggests the same crashes are occurring, but are thankfully no longer resulting in deaths.
Many factors have contributed to Australia’s road toll reduction. Pre-1972 data isn’t available, but presumably the introduction of absolute speed limits helped. Certainly the introduction of random breath testing in late-1982 coincides with a decrease in road deaths from 21.4 (1982) to 17.4 (1982) deaths per billion kilometres travelled.

1
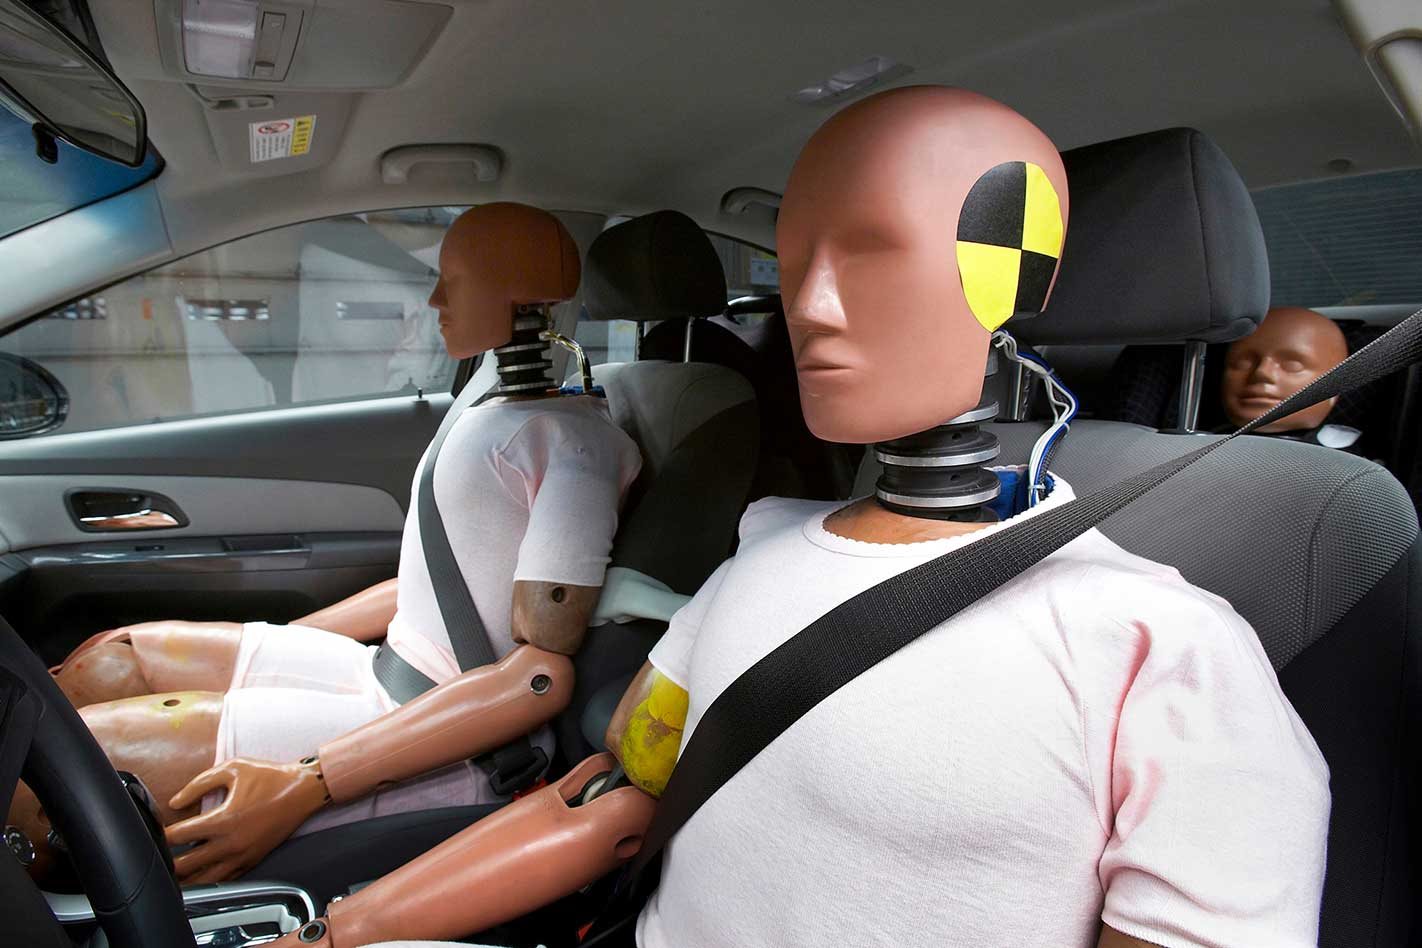
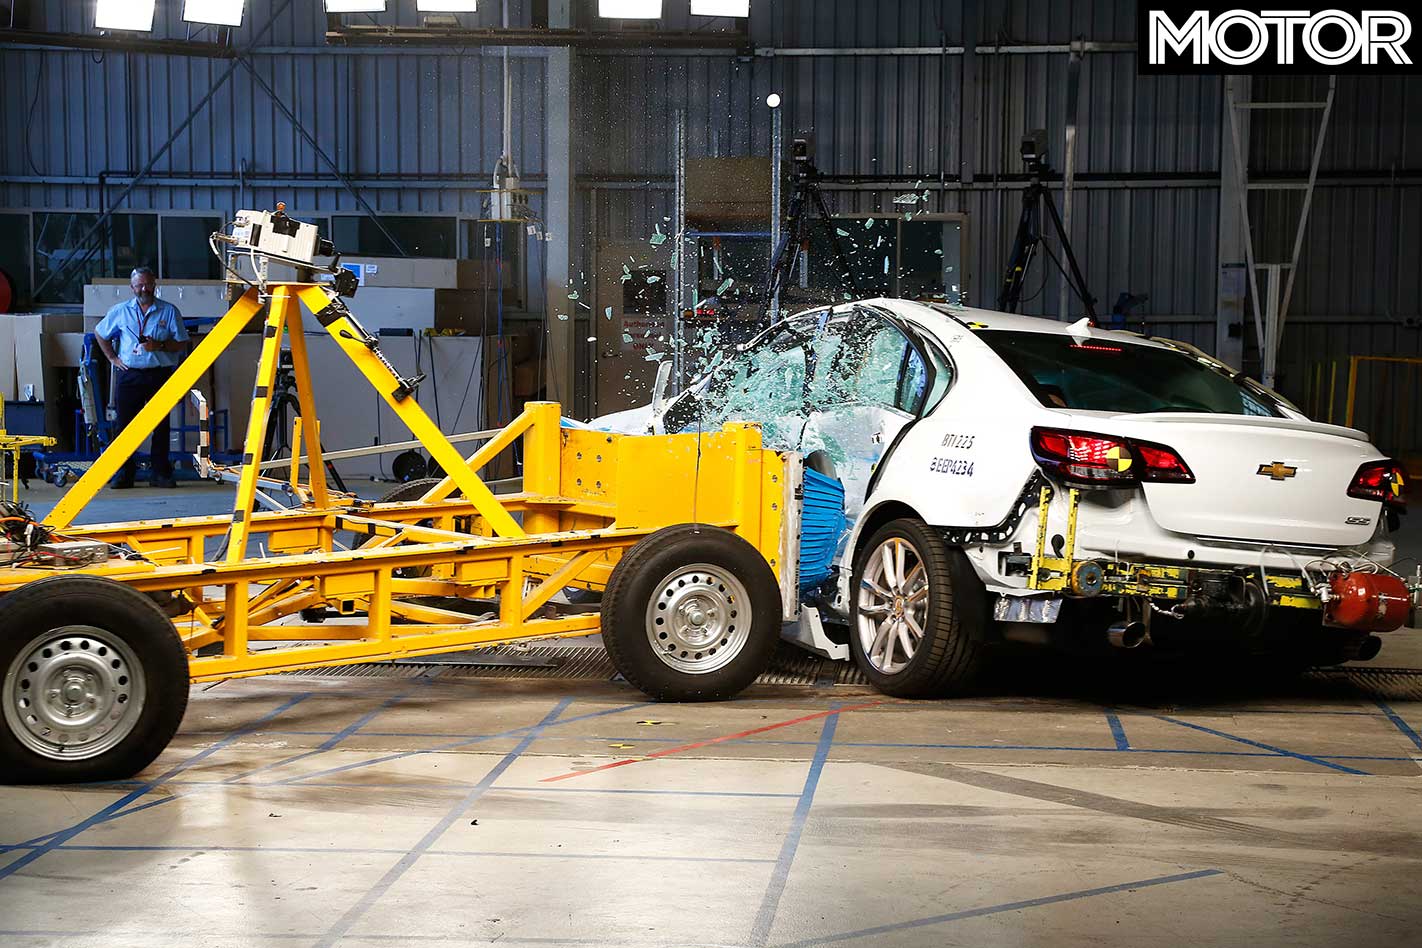
The 1990s also saw an enormous drop in fatal accidents, from 15.2 deaths per billion kilometres in 1988 to 6.76 a decade later. Is it a coincidence that this fall coincides with the increasingly widespread rollout of airbags and the formation of the Australian crash-testing authority ANCAP? Perhaps.
One thing that hasn’t changed over the years? Driver education and the numbers around it. For example, the Queensland Government’s transport website says an average modern family car with good tyres and brakes will stop from 100km/h on a dry road in 56 metres (not including reaction time).
1
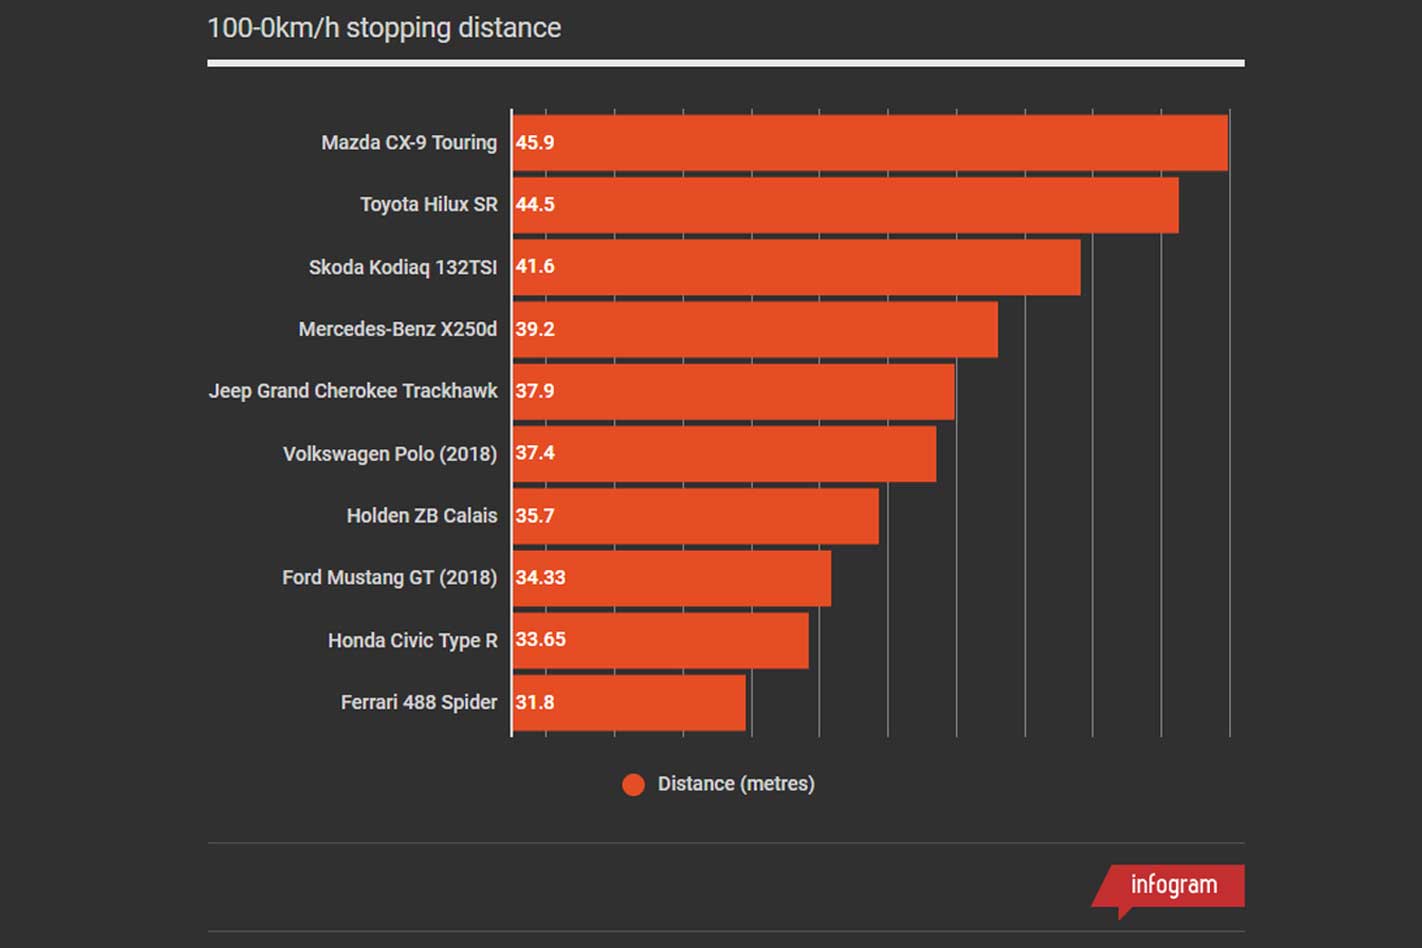
Compare this with 100-0km/h stopping data pulled from recent MOTOR and Wheels road tests:
Table 5. 100-0km/h stopping distances
1
Using conservative stopping distances is extremely important in order to indicate a worst-case scenario, but in what year did a “modern average family sedan” take 58m to stop from 100km/h? A Holden HQ Kingswood SL 4.2, for example, managed the feat in 43m (Modern MOTOR, February 1978).
Once again, the easiest way to stop people being hurt in crashes is to prevent them occurring and that means better educated, more skilful drivers.
Follow WhichCar/Wheels on Google
Click the button below to make WhichCar by Wheels a preferred source for your news.