Opinion
Gallery1
FOLLOWING on from Volkswagen’s so-called diesel scandal, where deliberately installed engine software was found to ‘cheat’ the very stringent US tests for NOx exhaust emissions, some other carmakers, including Mitsubishi and Suzuki, have been found to be fudging fuel-consumption figures.
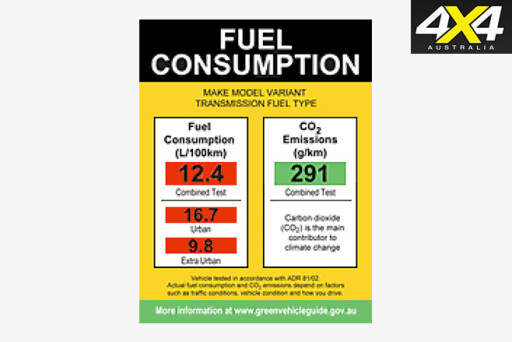
Here at 4X4 Australia we don’t test new 4x4s for emissions, but we do test very carefully for fuel use. What we have noticed over the past decade or more is that while mandatory government-test fuel figures (stated on the yellow windscreen labels) have come down progressively and quite markedly, real-world fuel consumption figures, while marginally better, haven’t improved to nearly the same extent.
The other trend we’ve noticed here is that the more sophisticated the powertrain in terms of electronic controls, fuel-delivery systems and gearbox type, the greater the discrepancy tends to be between the official test figure and the real-world figure.
Powertrain engineers will readily admit that when you have very sophisticated fuel mapping, finely optimised high-pressure injection (either petrol or diesel) and automatic gearboxes with up to nine speeds, it’s not all that hard to tweak the powertrain response to the loads placed on it in the official test. After all, the official test has a fixed set of ‘driving events’, whose protocols are well known.
You could argue that optimising the powertrain’s response to the official test is not cheating, but that’s another story. Either way, our official ADR test, based on a European regulation, isn’t particularly indicative of real-world Australian conditions, with very low average speeds (see breakout), so it’s no surprise that the official figures are well under real-world usage even with older manual powertrains with minimal electronic control.
 Owners often complain that their new 4x4 uses a lot more fuel than what the windscreen label states, but probably fail to realise that the label figure is what the car used in the official – and effectively theoretical – test. The manufacturer is not saying this is how much fuel the vehicle will use when you drive it in the real world.
So the problem lies not with the vehicle manufacturer as such but with a test procedure that fails to replicate real-world conditions. If you are going to blame anyone for the discrepancy between the official and real-world figures, blame the federal government’s bureaucrats for adopting this particular test procedure, which was devised by other bureaucrats in Europe.
Interestingly, the USA’s Environmental Protection Agency uses a combination of laboratory tests and real-world data to inform would-be car buyers what sort of fuel consumption they can expect. This gives a more accurate figure, but it does come at considerable public cost.
While the fuel consumption numbers quoted on the windscreen label are normally well below what you will achieve in the real world, there’s still some relativity between them, so they do have some validity as a buying tool.
TESTING TIMES
ALL new vehicles sold in Australia are subject to Australian Design Rule (ADR) 81/02. This is a fuel-consumption test based on the Economic Commission for Europe Regulation 101. The test is carried out on a ‘rolling road’ dynamometer in a laboratory, not on actual real-world roads.
The test covers a mere (and theoretical) 11km, and is done in two parts. The first, called the Urban Cycle, is from a cold start and consists of a series of accelerations, steady speeds, decelerations and idling. The maximum speed is 50km/h, the average speed is 19km/h and the distance ‘covered’ is just 4km.
The second test, called the Extra Urban Cycle, is conducted straight after the Urban Cycle (hot start) and consists of approximately half steady-speed driving with the remainder being acceleration, deceleration and some idling. The average speed is 63km/h, with one spike that reaches 120km/h. The total second test ‘distance’ is 7km.
Please enable JavaScript to view the comments powered by Disqus.
COMMENTS