COTY

Gallery 1
When it comes to automotive top trumps, a car’s 0-100km/h time is usually the headline figure to debate.
There is something beautifully representative about 0-100km/h times as they encapsulate the performance of a car in terms that are simple to understand.
However, sometimes manufacturers can get a little… optimistic… with how fast they think a new car can complete the sprint. So, we decided to put a large group of cars to the test.
Testing took place at Holden’s Lang Lang proving ground as part of Wheels Car of the Year 2020, with veteran judge Byron Mathioudakis at the helm. All figures were measured using a VBOX data recorder to ensure accuracy. Unlike our friends in America, we don’t allow a ‘roll out’, with measurements done from a complete standstill.
In total, 31 vehicles were tested, representing 17 models.
A surprising number of manufacturer’s seemed to be underquoting their performance figures, with 10 models coming in under their official claimed times.
1
The biggest difference came from Mazda, with the G20 Pure hatch a full half a second quicker than its claimed time, with our data revealing a 0-100km/h sprint of 9 seconds flat.
Mercedes-Benz also underquoted the performance capabilities of its EQC, with the two variants on test both beating claimed acceleration figures. The model rolling on 20-inch rims was quickest with a 4.7 second sprint (four tenths faster than claimed), while the variant fitted with 21-inch wheels was a tenth slower.
Both variants of the Peugeot 508 were quicker than claimed, with the sedan recording a 7.8 second sprint (against a 8.1 second claim), and the wagon being measured at 8 seconds flat (compared to a 8.2 second claim).
Tesla’s Model 3 Standard Range beat its claimed acceleration figure by 3 tenths (we recorded a 5.3 second sprint), while the Performance variant was just a tenth slower than what is on the brochure at 3.5 seconds.
1
Toyota’s RAV4 range was diametric in its results. The GX petrol and Cruiser Hybrid beat their acceleration claims (by three and four tenths respectively), while the Edge was 1.3 seconds slower than reported by the manufacturer.
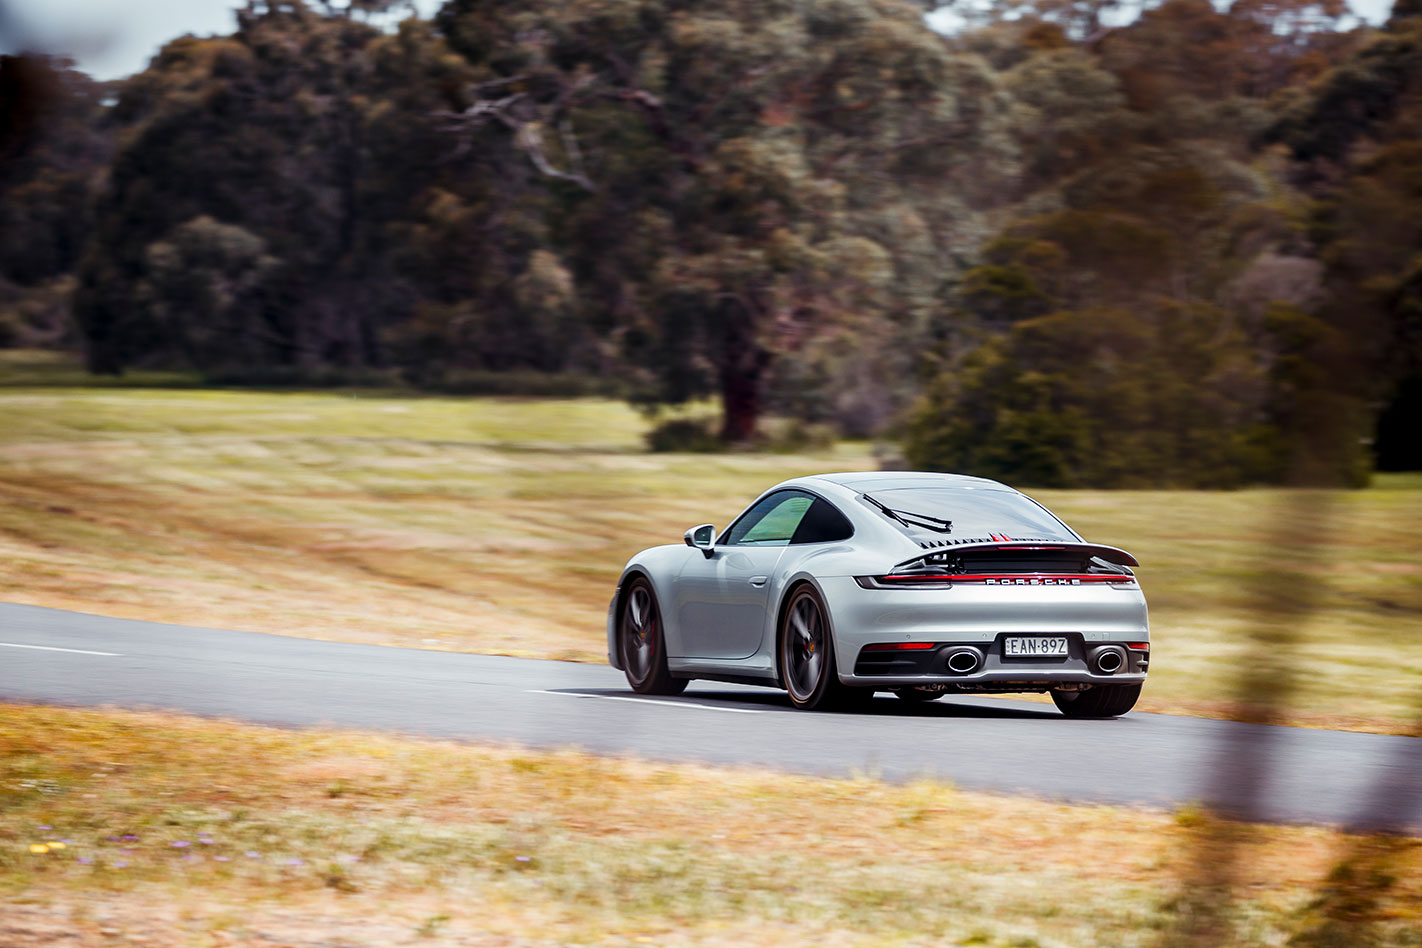
Porsche, as usual, was quicker than claimed with the 992 911 Carrera S.
The biggest cavern of difference between claimed and tested 0-100km/h times was reserved for the Genesis G70 2.0T sport, which was 1.7 seconds slower during our testing.
Range Rover has the unfortunate honour of being both the slowest car during our test, and also one of the further from the official manufacturer claim.
1
The Evoque D180 S has a claimed 0-100km/h sprint time of 9.3 seconds, but the best that we were able to extract from the small SUV was a 10.4 second run, more than a second slower.
Other cars that were a second or more from the claimed time include the Volkswagen Touareg 190TDI and Volvo S60 T8 R-Design.
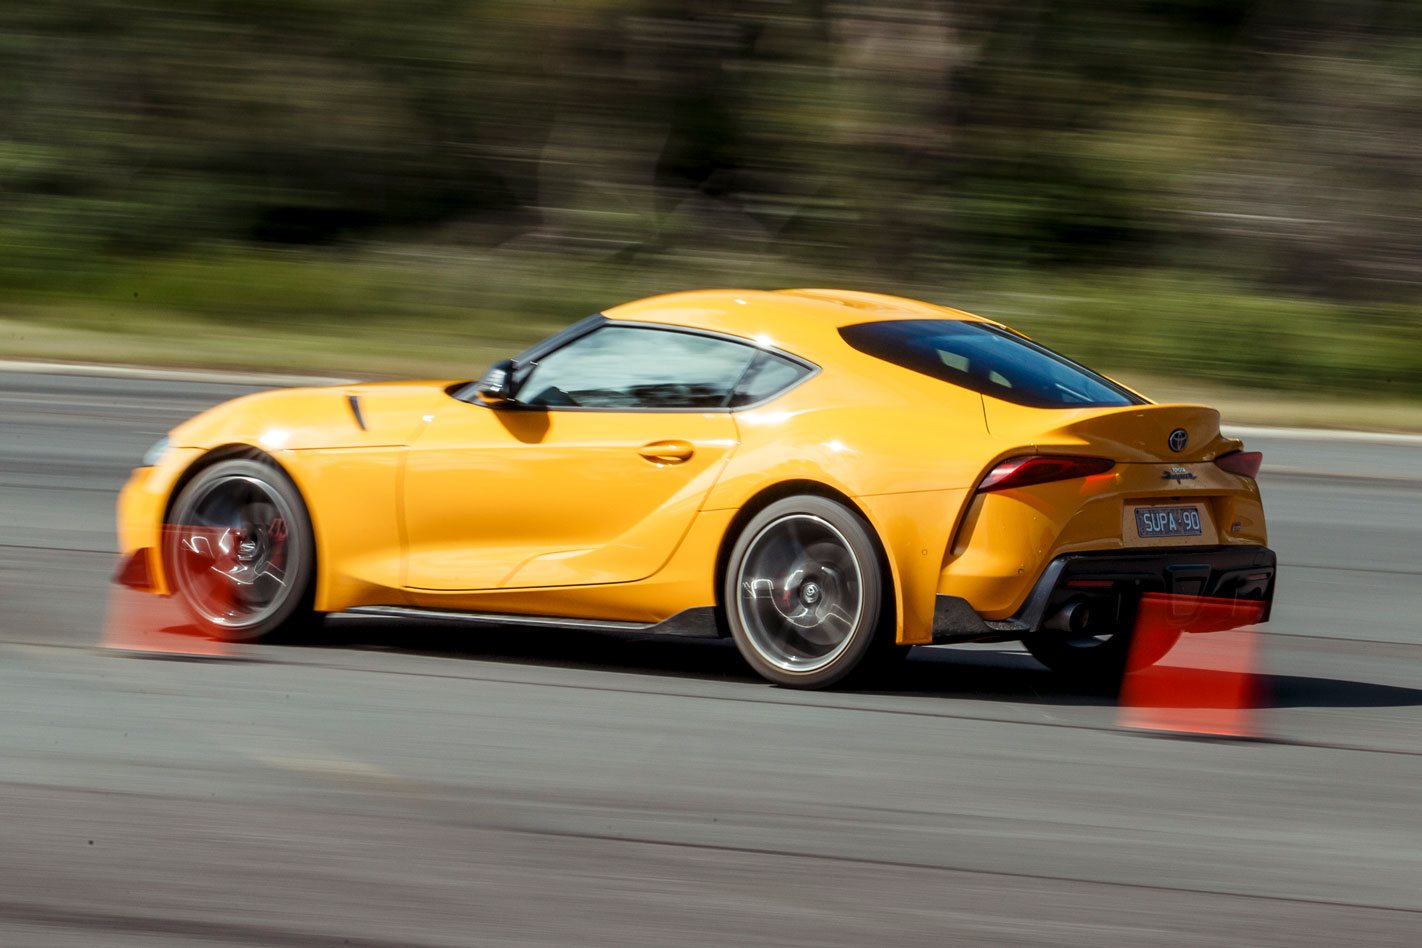
The most accurate claim was the Toyota Supra, with the Japanese brand quoting a 4.4 second sprint to 100km/h, a figure we were able to replicate.
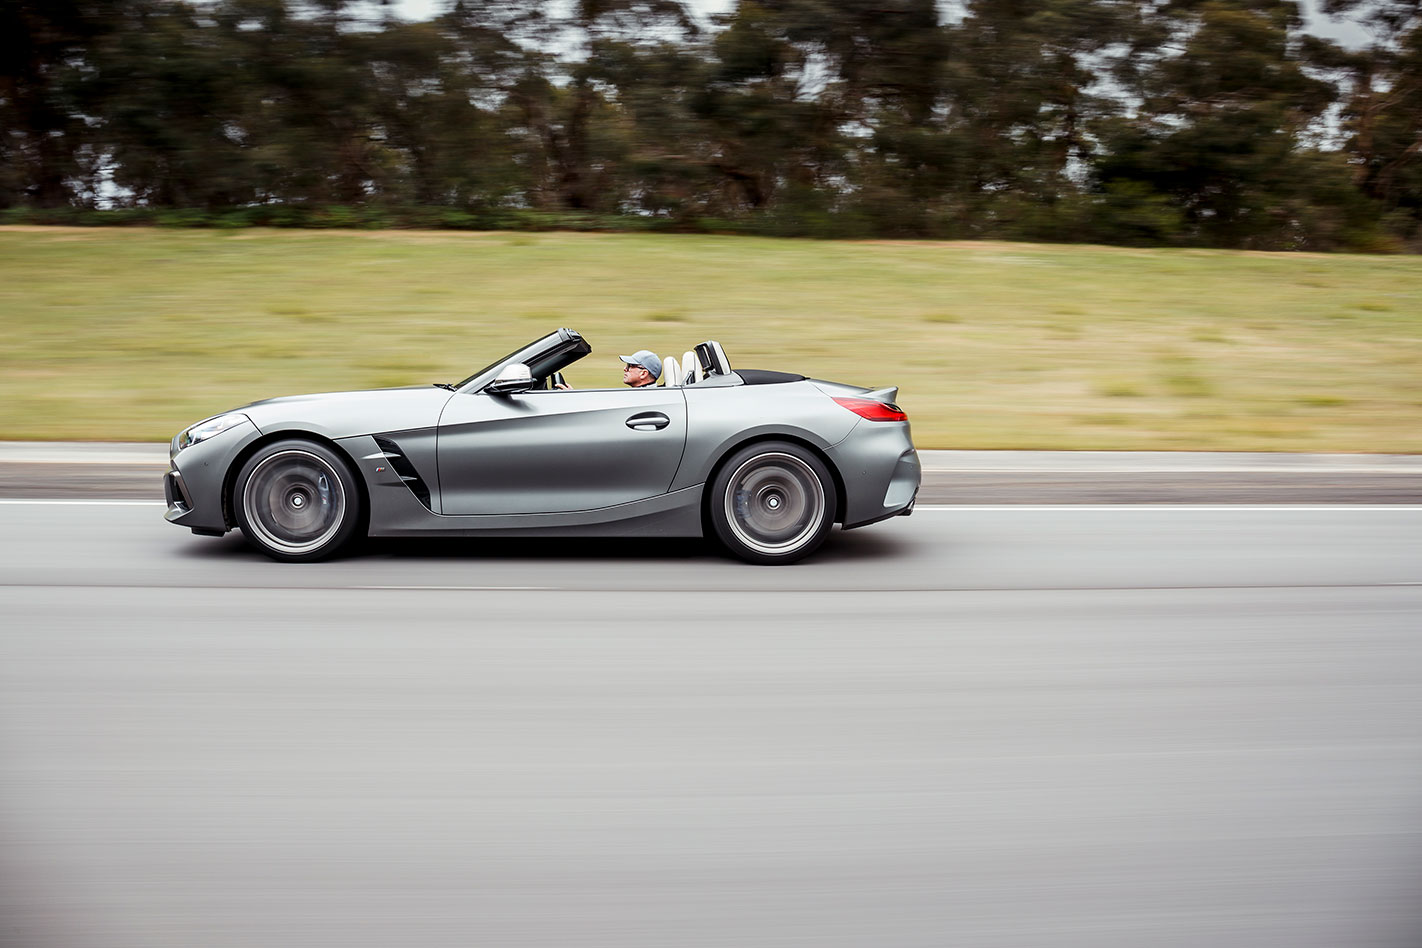
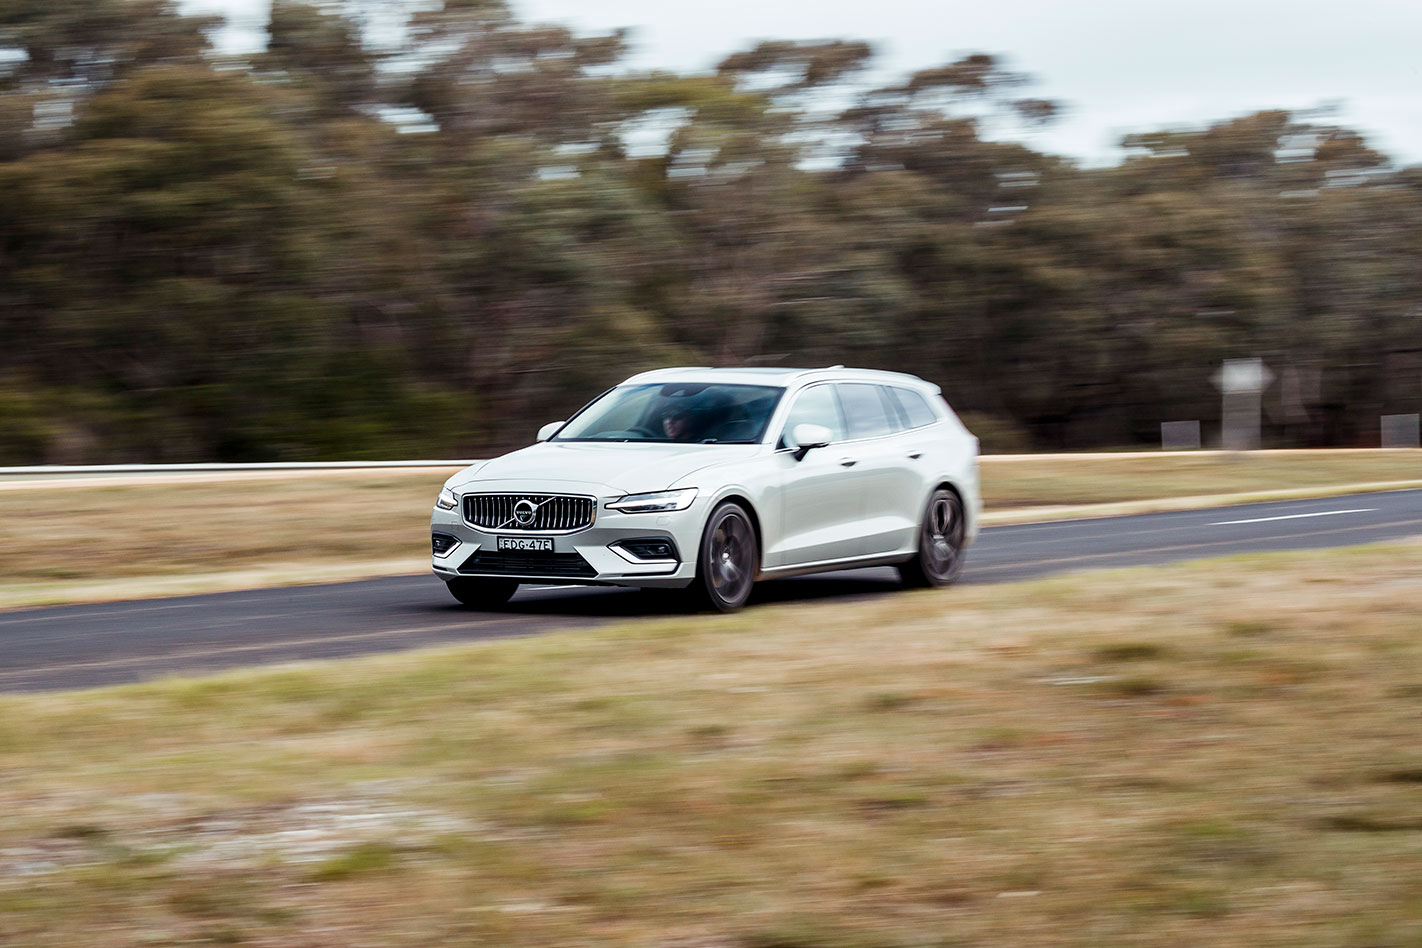
Falling within a tenth of a second of the manufacturer claim was the BMW 3 Series M340i, BMW X5 30d, BMW Z4 M40i, Nissan Leaf, and Volvo V60 T5 Inscription.
The full breakdown of data can be found below.
Full testing data from Wheels Car of the Year 2020:
| Car | Claimed 0-100km/h | Tested 0-100km/h | Difference |
| Audi A1 30 TFSI S-Tronic | 9.4s | 9.6s | 0.2s |
| Audi A1 35 TFSI | 7.7s | 8.3s | 0.6s |
| Audi Q3 35 TFSI Launch Edition | 9.3s | 9.5s | 0.2s |
| BMW 3 Series 330i | 5.8s | 6.2s | 0.4s |
| BMW 3 Series M340i | 4.4s | 4.5s | 0.1s |
| BMW X5 40i | 5.5s | 5.8s | 0.3s |
| BMW X5 30d | 6.5s | 6.6s | 0.1s |
| BMW Z4 20i | 6.6s | 7.1s | 0.5s |
| BMW Z4 M40i | 4.5s | 4.6s | 0.1s |
| Genesis G70 2.0T Sport | 5.9s | 7.6s | 1.7s |
| Genesis G70 3.3T Ultimate Sport | 4.7s | 5.2s | 0.5s |
| Mazda 3 G20 Pure hatch | 9.5s | 9.0s | -0.5s |
| Mazda 3 G25 Astina sedan | 8.0s | 7.9s | -0.1s |
| Mercedes-Benz EQC (20-inch) | 5.1s | 4.7s | -0.4s |
| Mercedes-Benz EQC (21-inch) | 5.1s | 4.8s | -0.3s |
| Nissan Leaf | 7.9s | 8.0s | 0.1s |
| Peugeot 508 sedan | 8.1s | 7.8s | -0.3s |
| Peugeot 508 wagon | 8.2s | 8.0s | -0.2s |
| Porsche 992 911 Carrera S | 3.5s | 3.4s | -0.1s |
| Range Rover Evoque P250 S R-Dynamic | 7.5s | 7.9s | 0.4s |
| Range Rover Evoque D180 S | 9.3s | 10.4s | 1.1s |
| Tesla Model 3 Standard Range Plus | 5.6s | 5.3s | -0.3s |
| Tesla Model 3 Performance | 3.4s | 3.5s | 0.1s |
| Toyota RAV4 GX 2.0 CVT FWD | 9.4s | 9.1s | -0.3s |
| Toyota RAV4 Cruiser Hybrid AWD | 8.0s | 7.6s | -0.4s |
| Toyota RAV4 Edge 2.5 | 7.9s | 9.2s | 1.3s |
| Toyota Supra GTS | 4.4s | 4.4s | 0.0s |
| Volkswagen Touareg 190TDI | 6.5s | 7.5s | 1.0s |
| Volvo S60 T5 Momentum | 6.4s | 7.0s | 0.6s |
| Volvo S60 T8 R-Design | 4.3s | 5.3s | 1.0s |
| Volvo V60 T5 Inscription | 6.4s | 6.5s | 0.1s |
Follow WhichCar/Wheels on Google
Click the button below to make WhichCar by Wheels a preferred source for your news.