News

Gallery 1
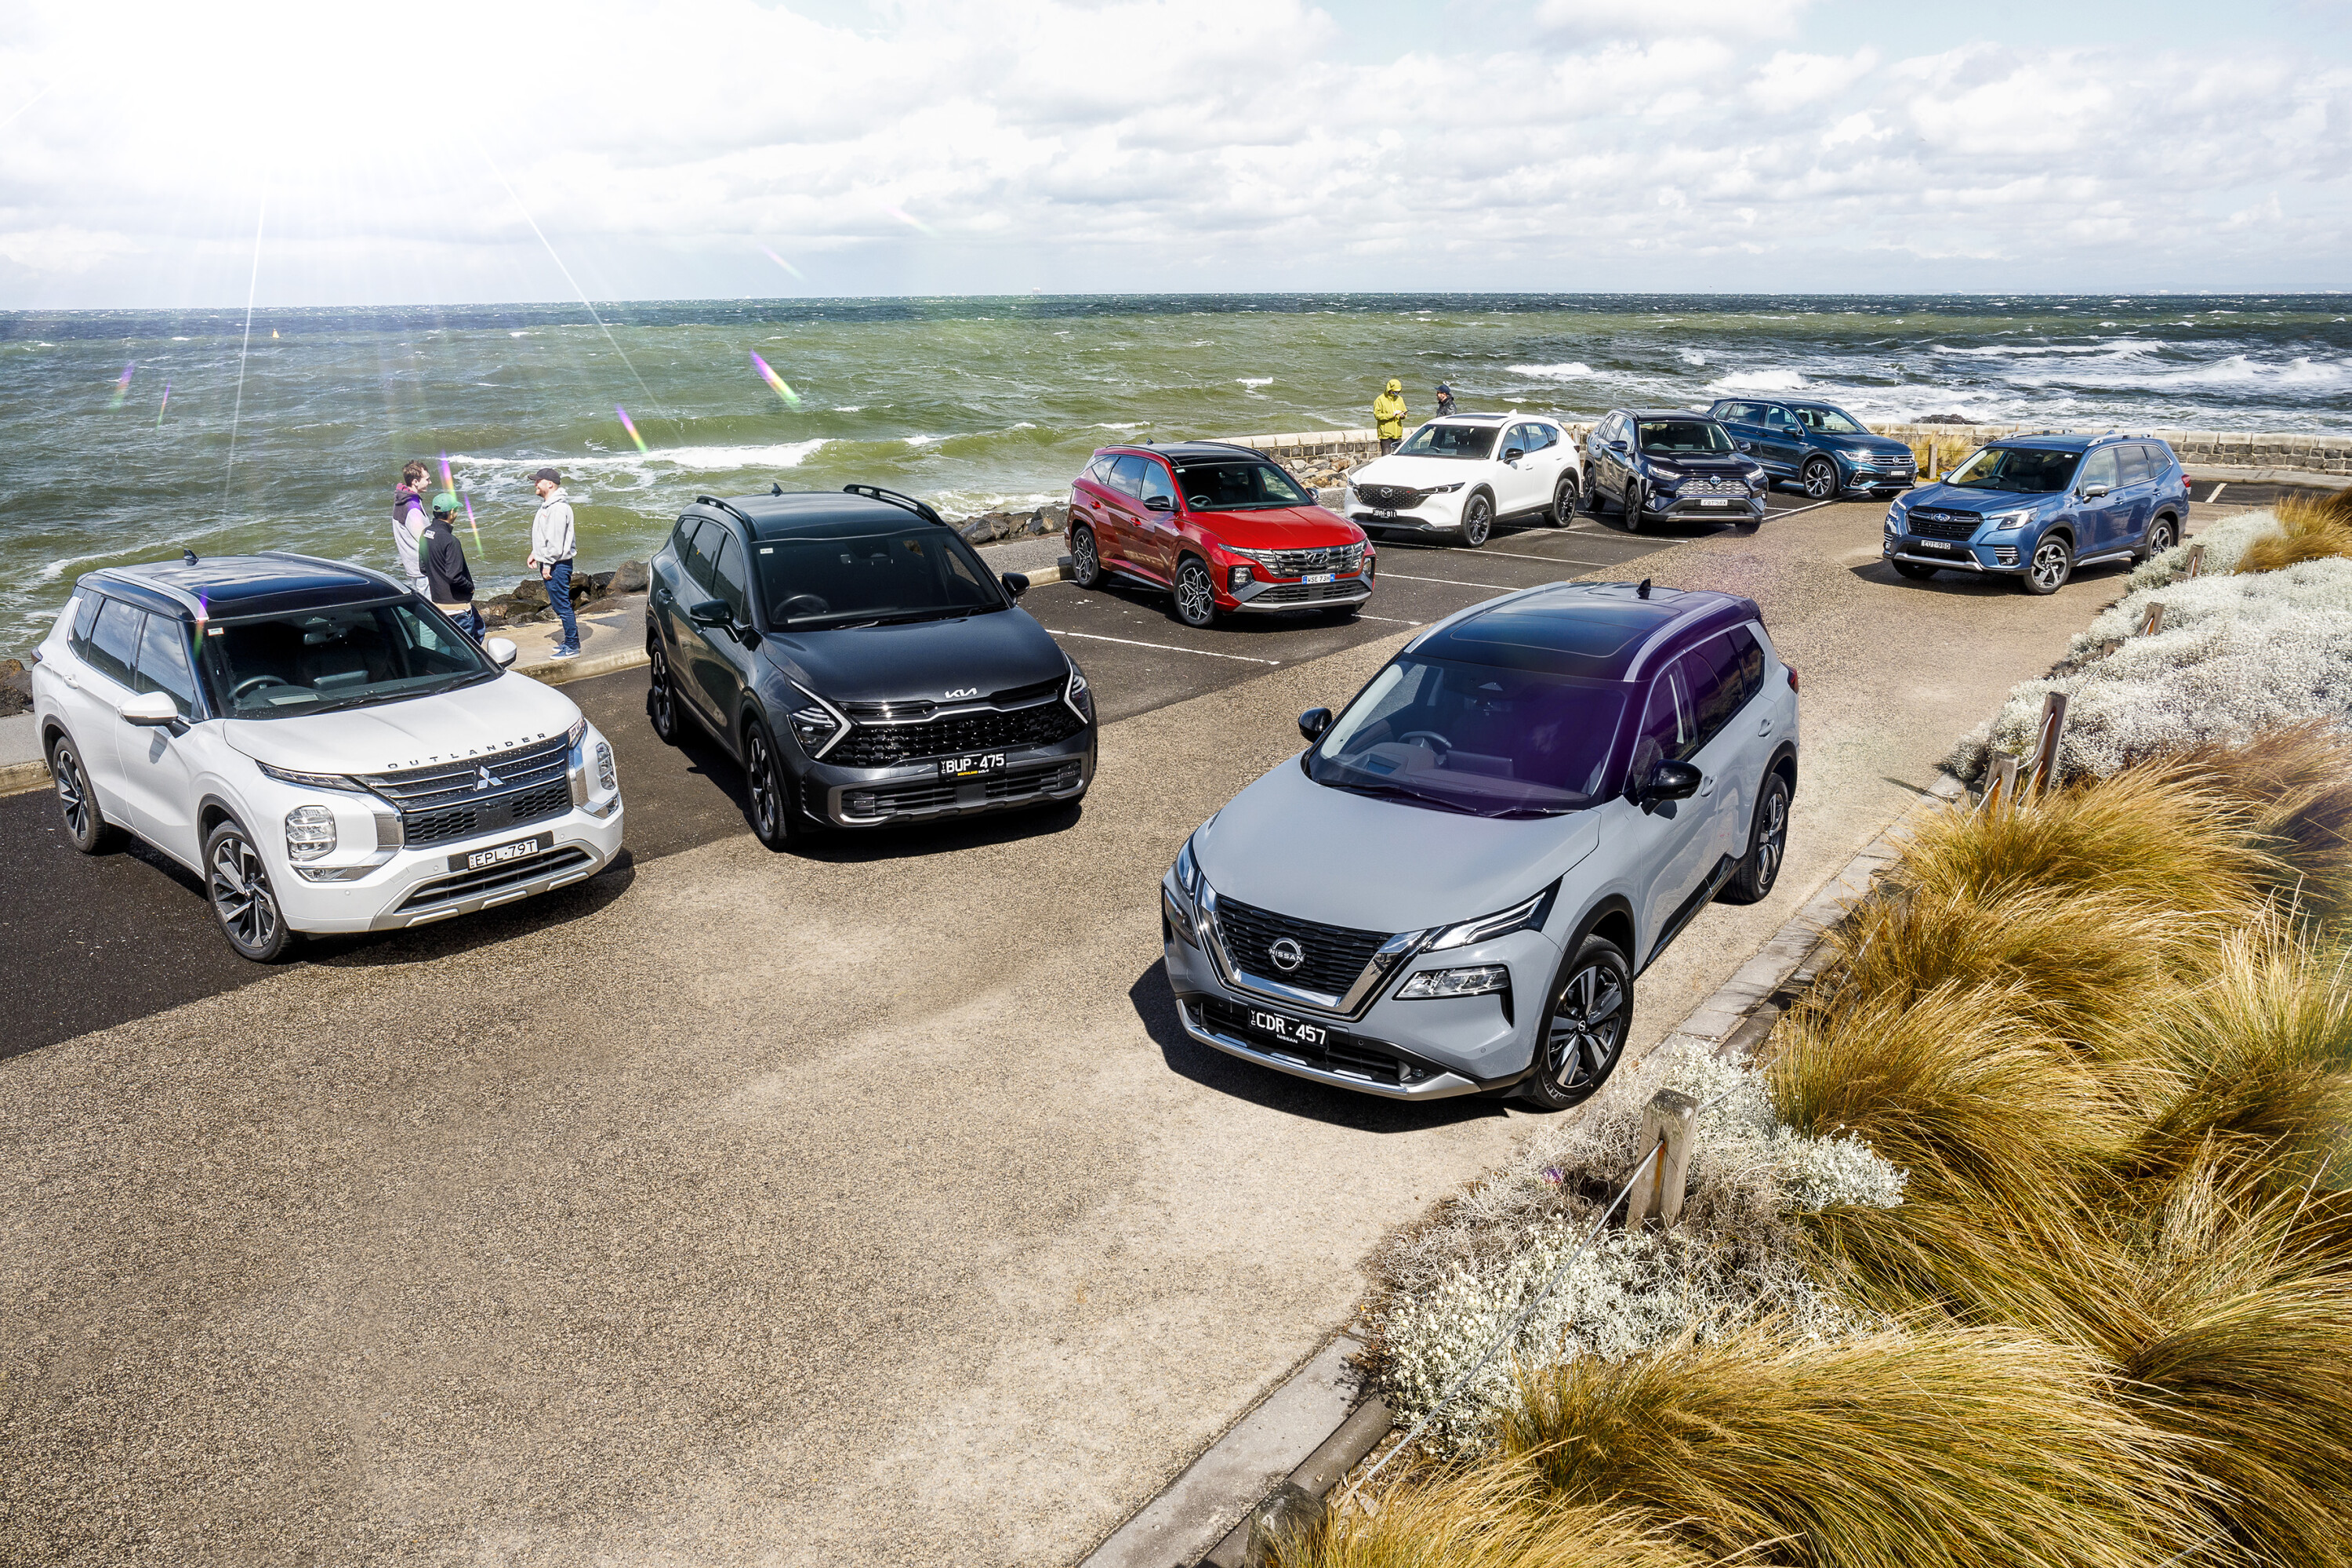
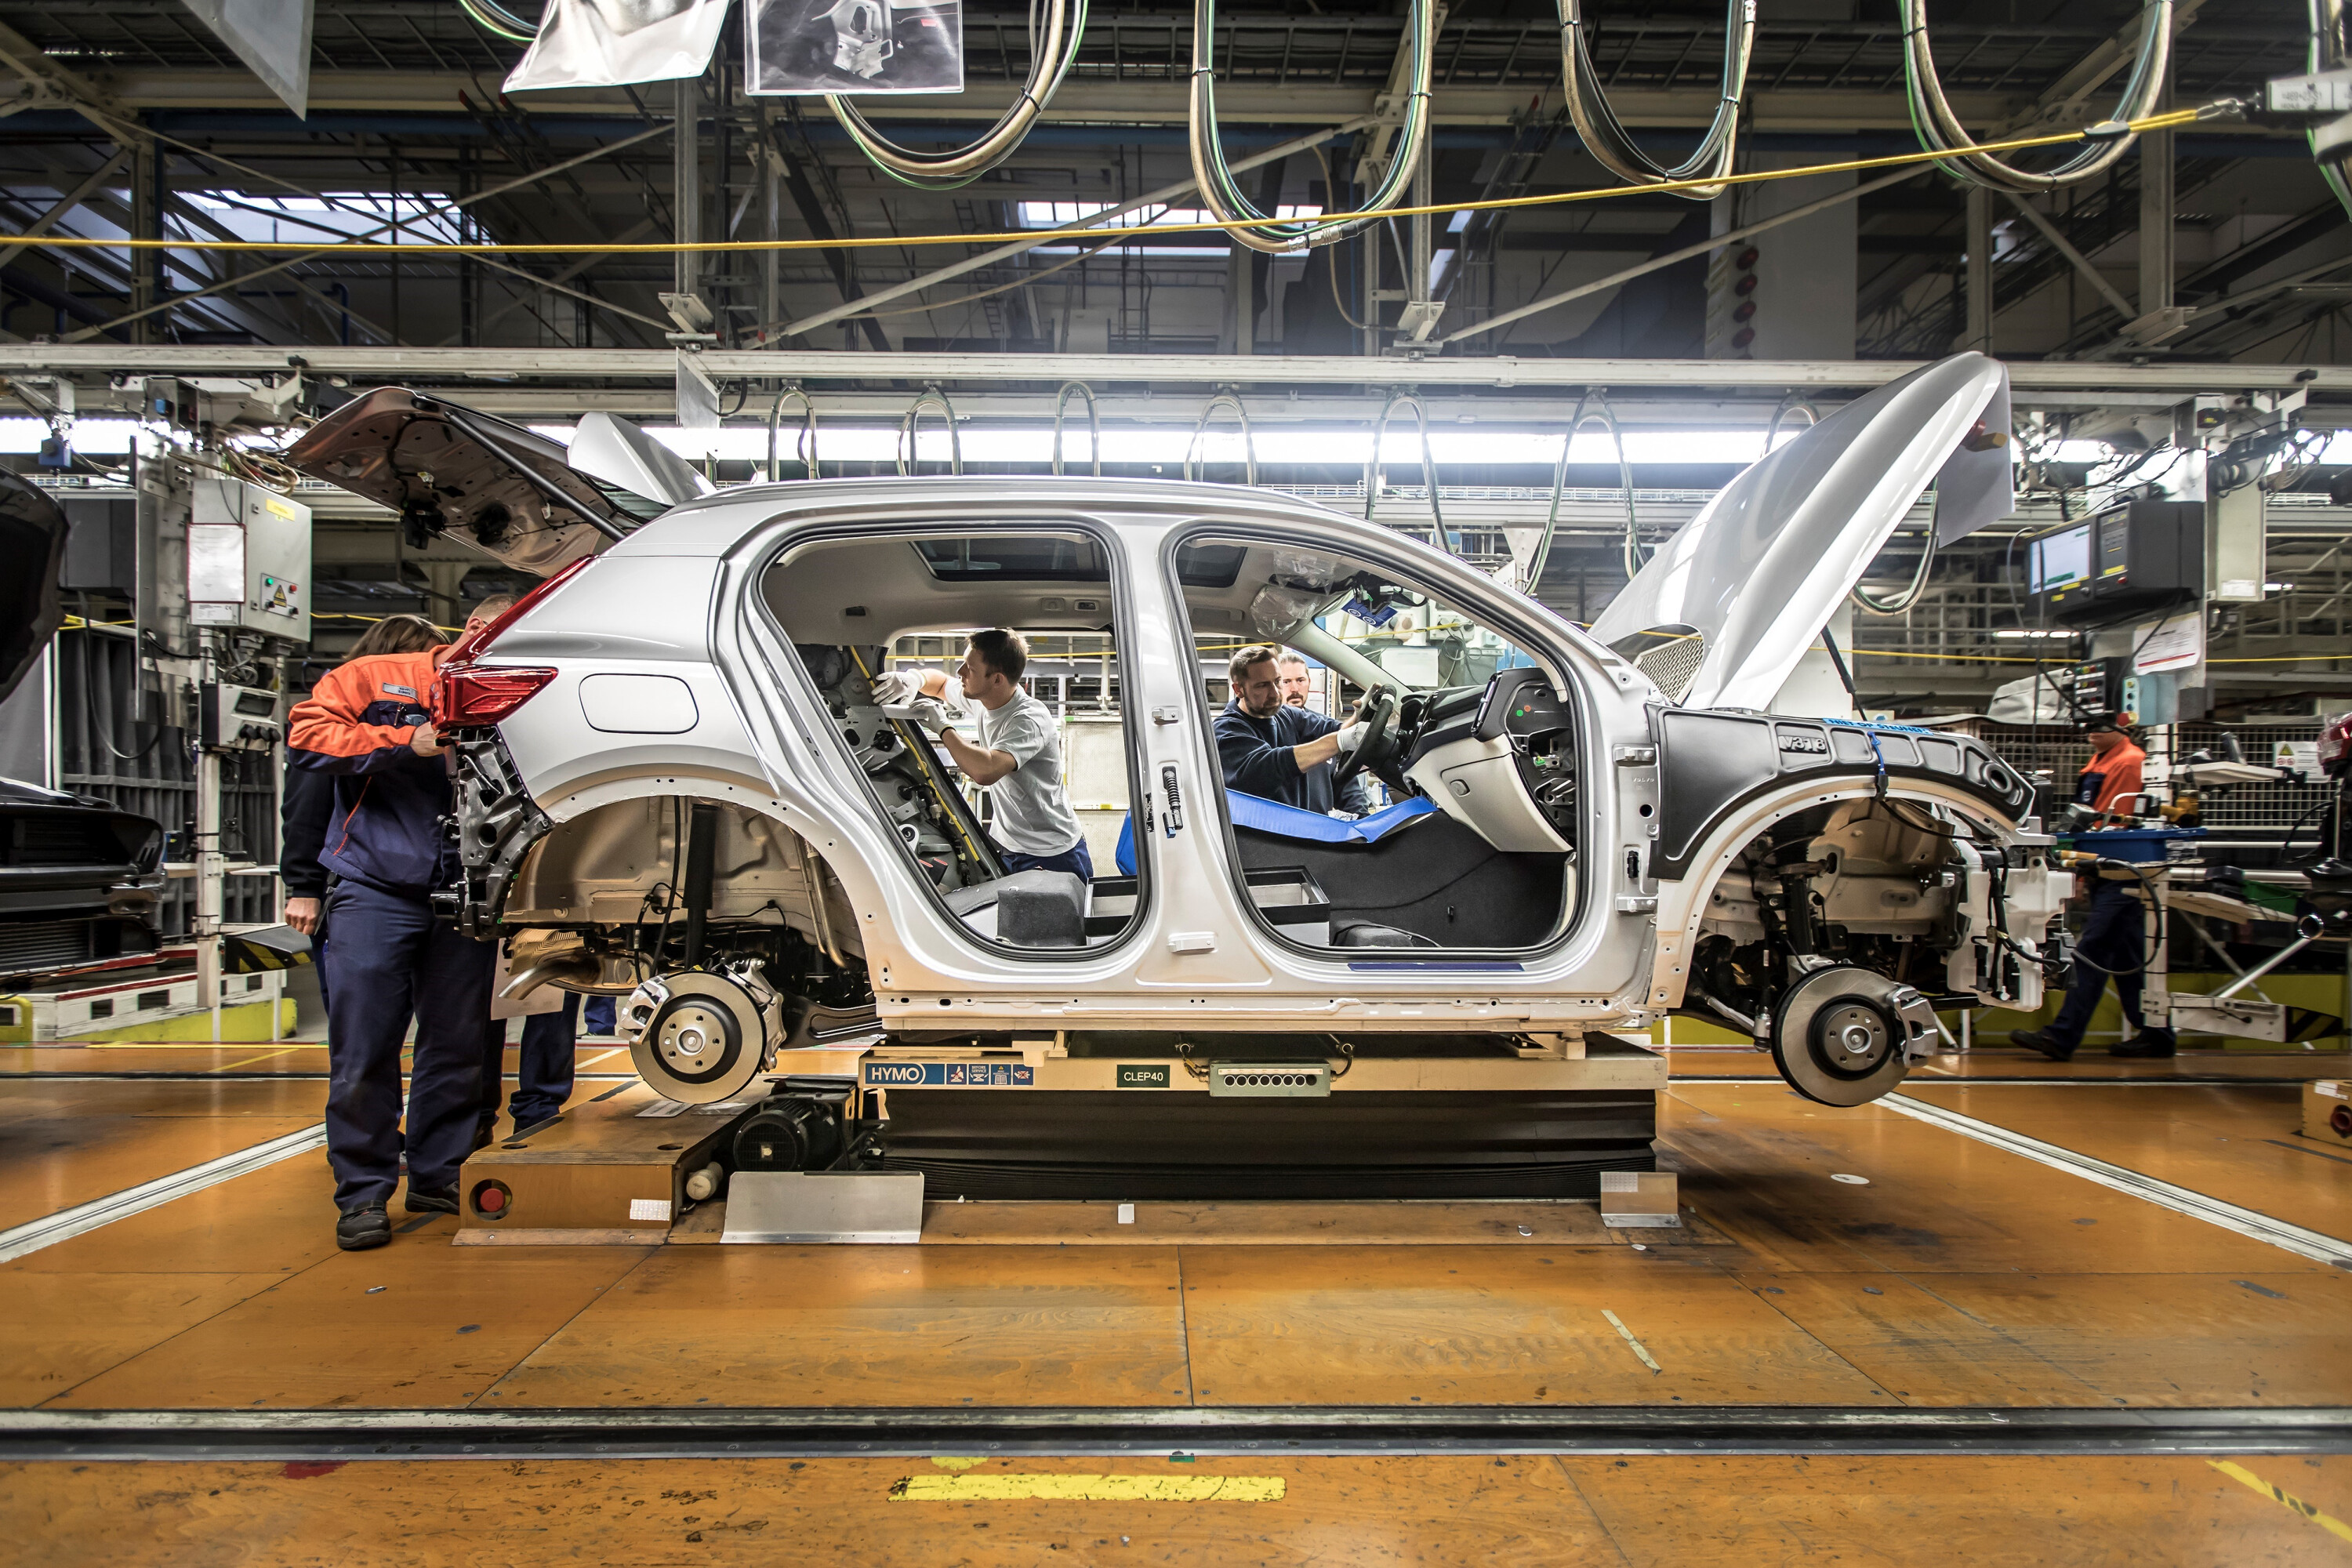
The Australian car market has posted its best August result ever as sales continue to recover following supply shortages.
According to official new-car sales results from the Federal Chamber of Automobile Industries (FCAI), 109,966 vehicles were registered in August – up 15% from 2022, when 95,256 cars were sold.
The previous highest August result was in 2017 when 96,662 vehicles were reported as sold.
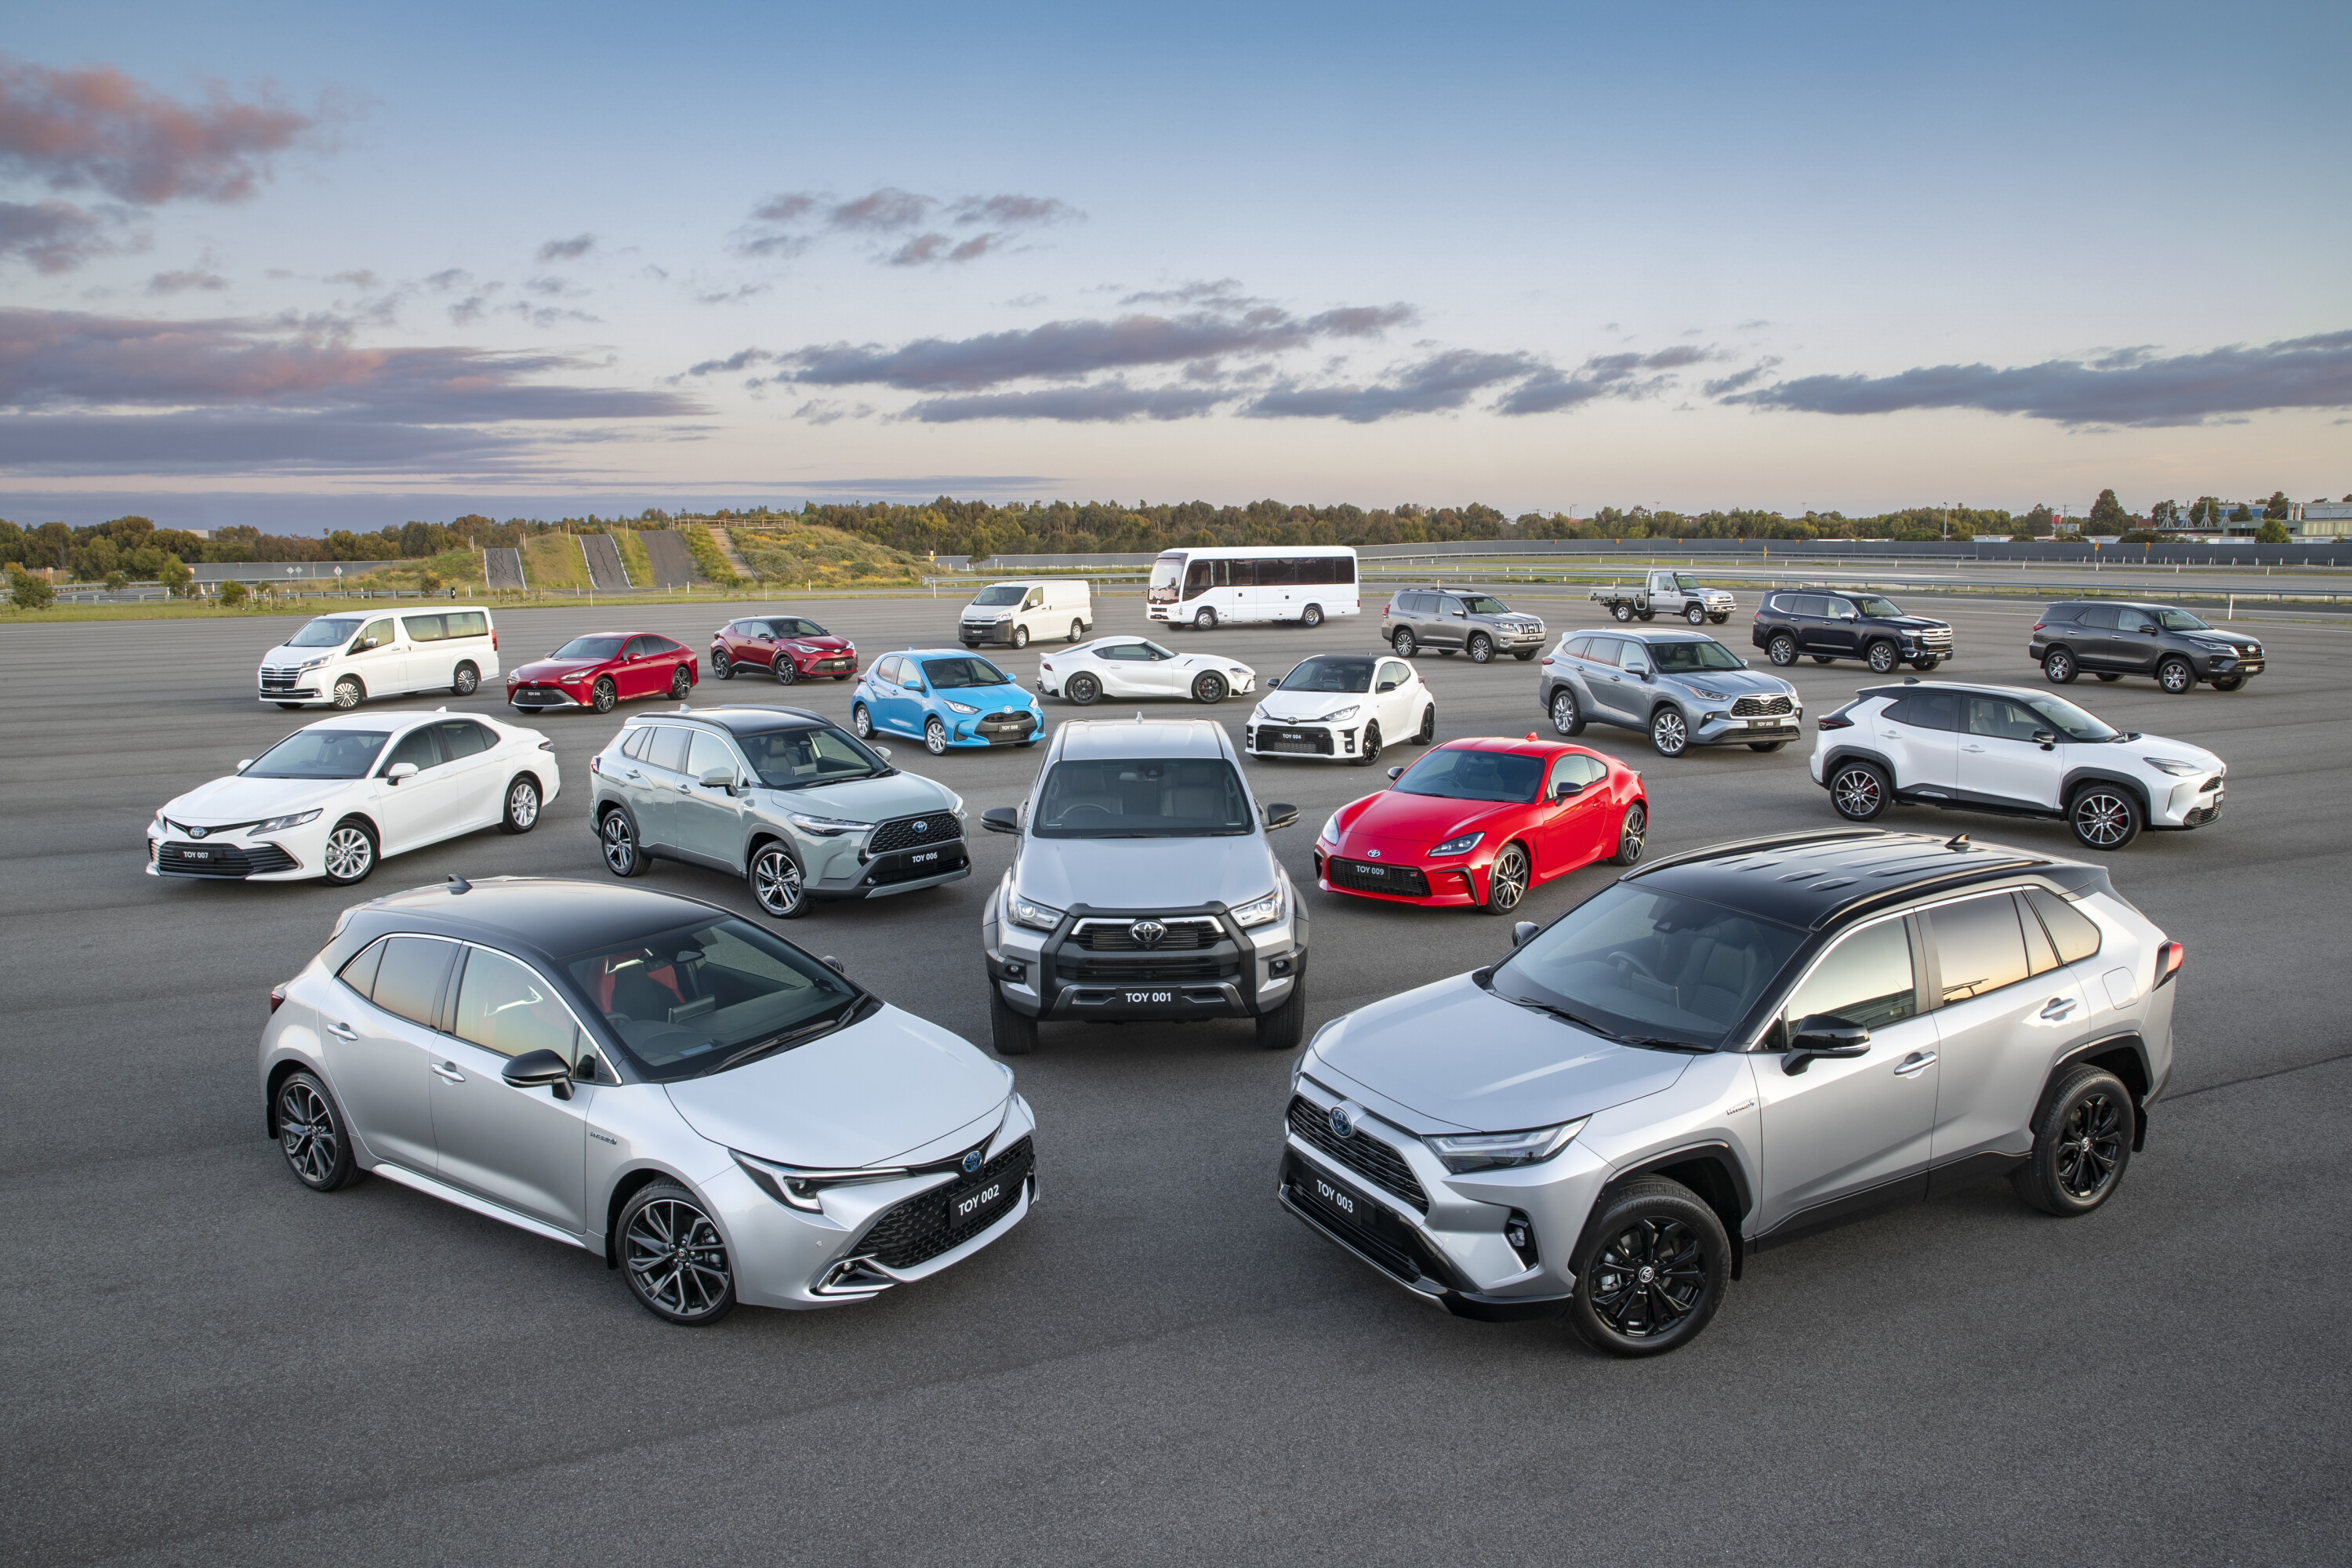
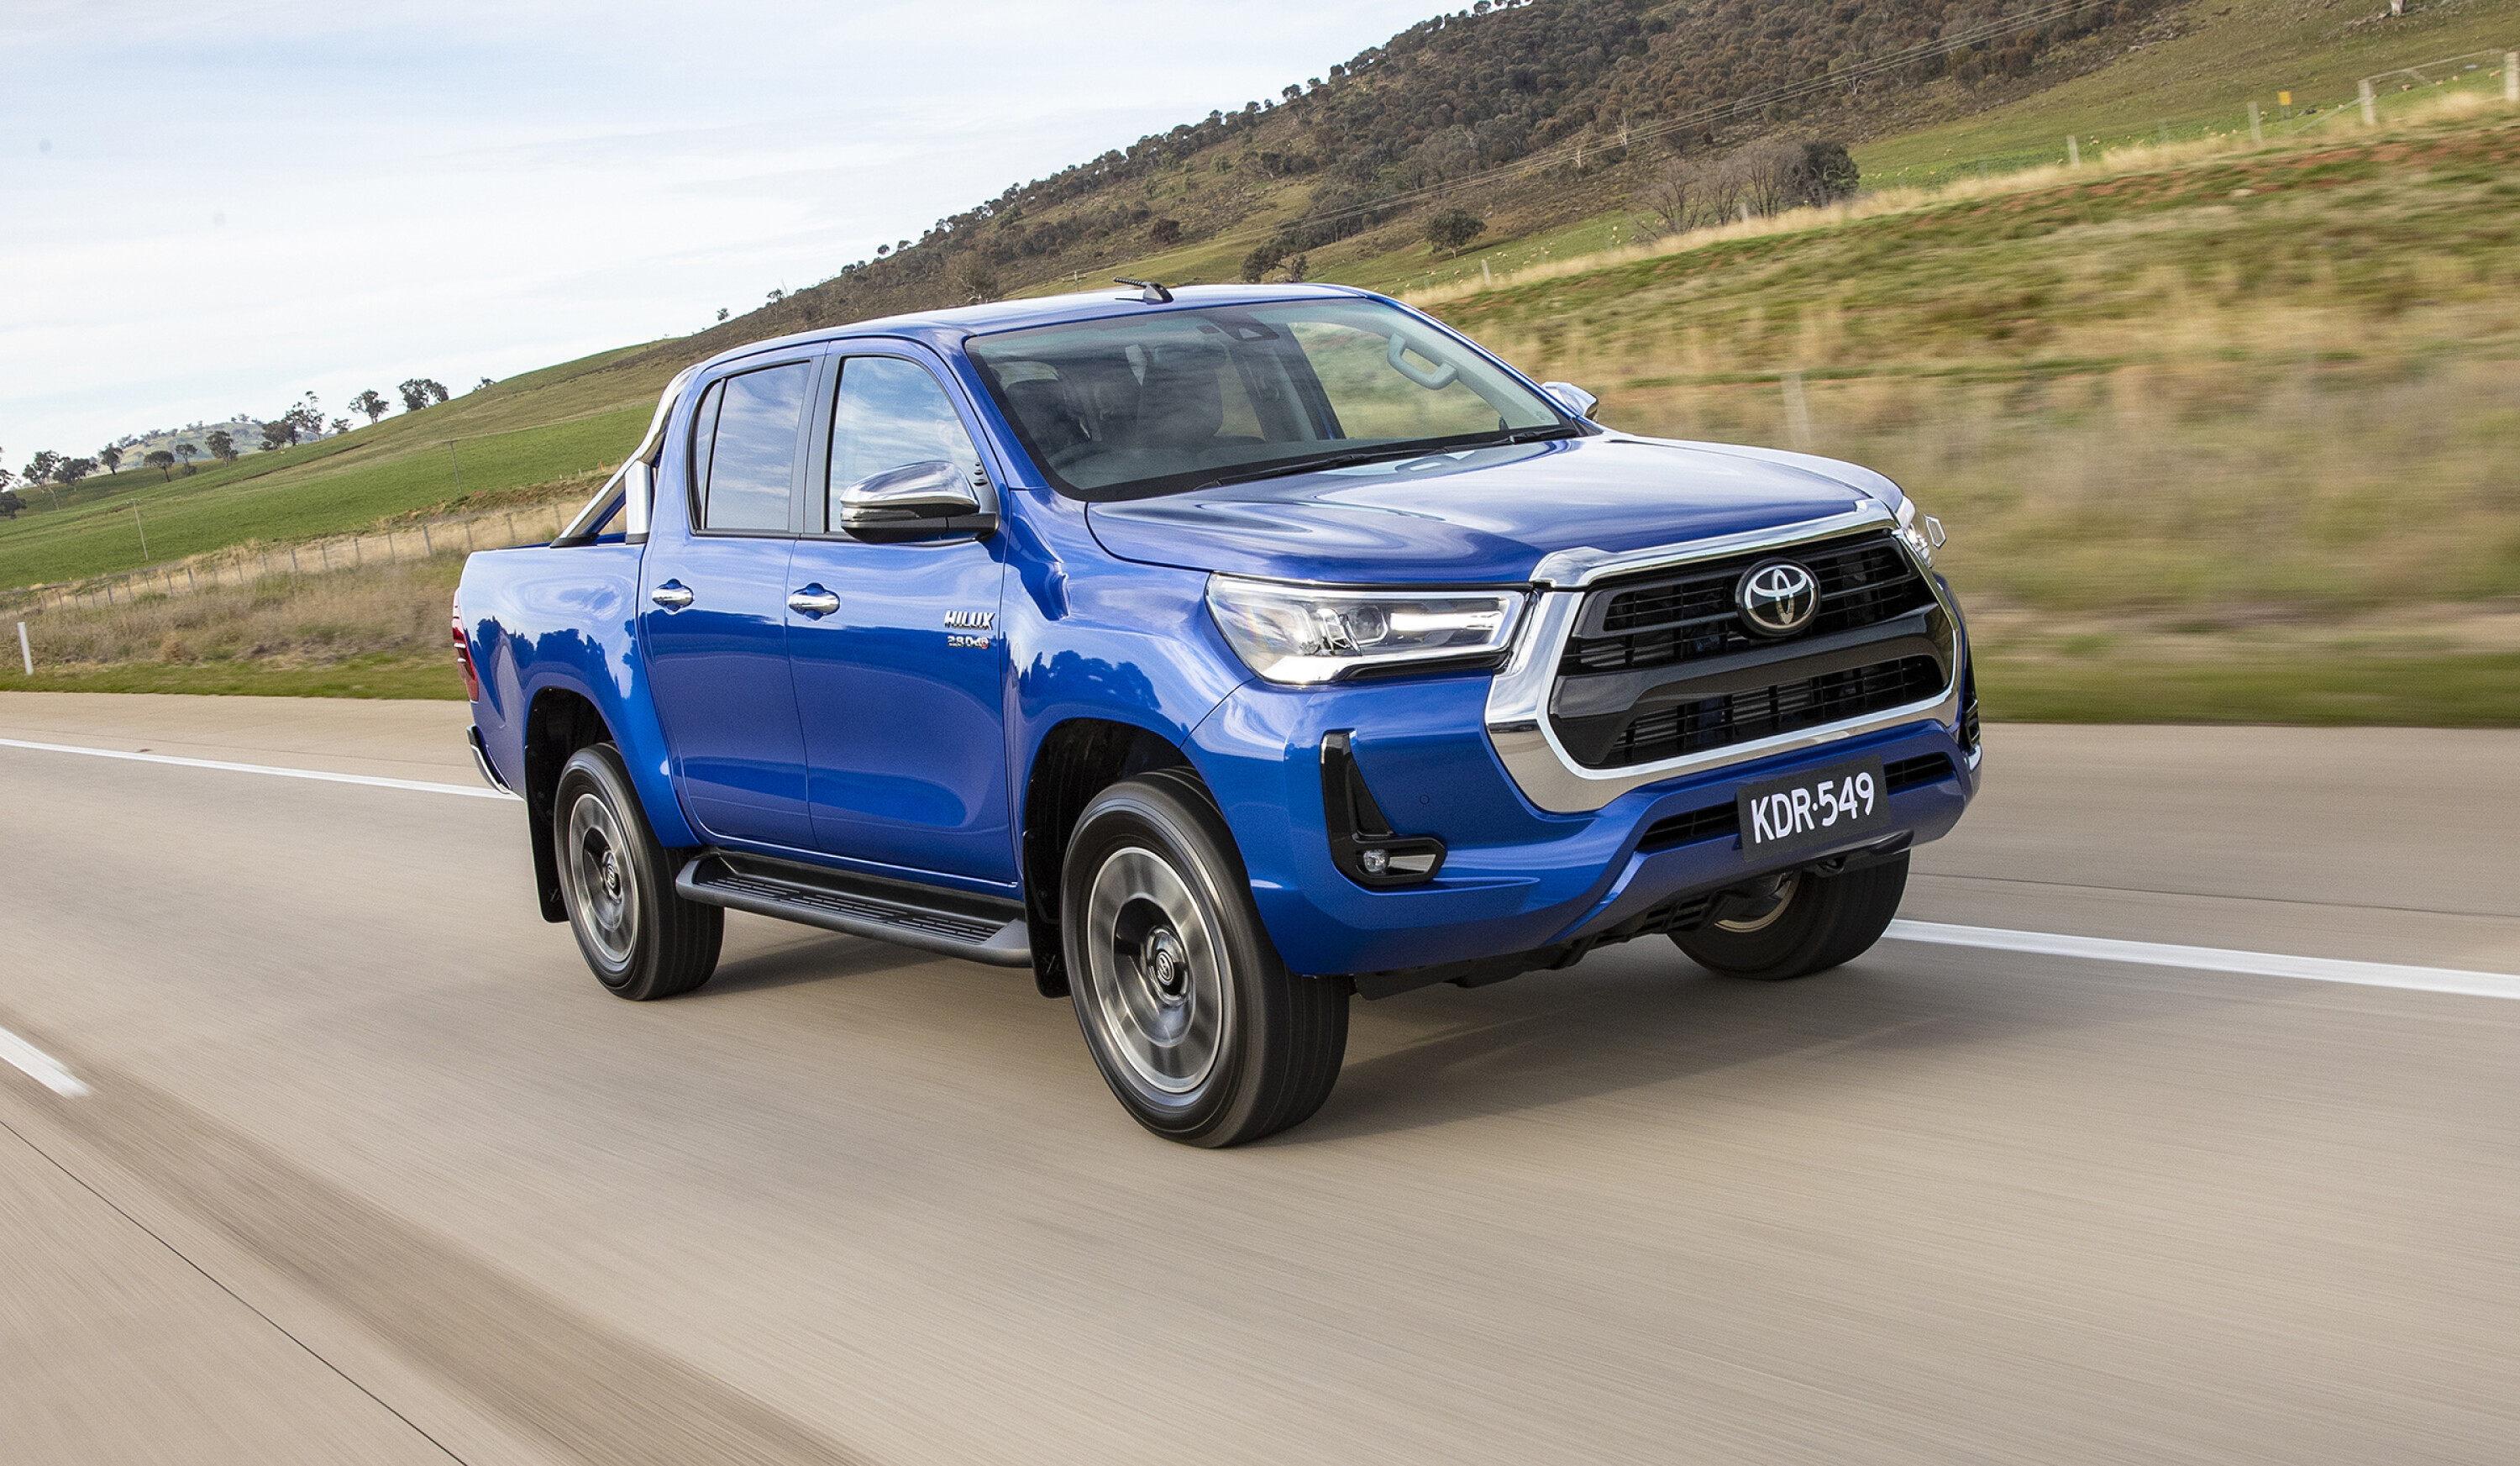
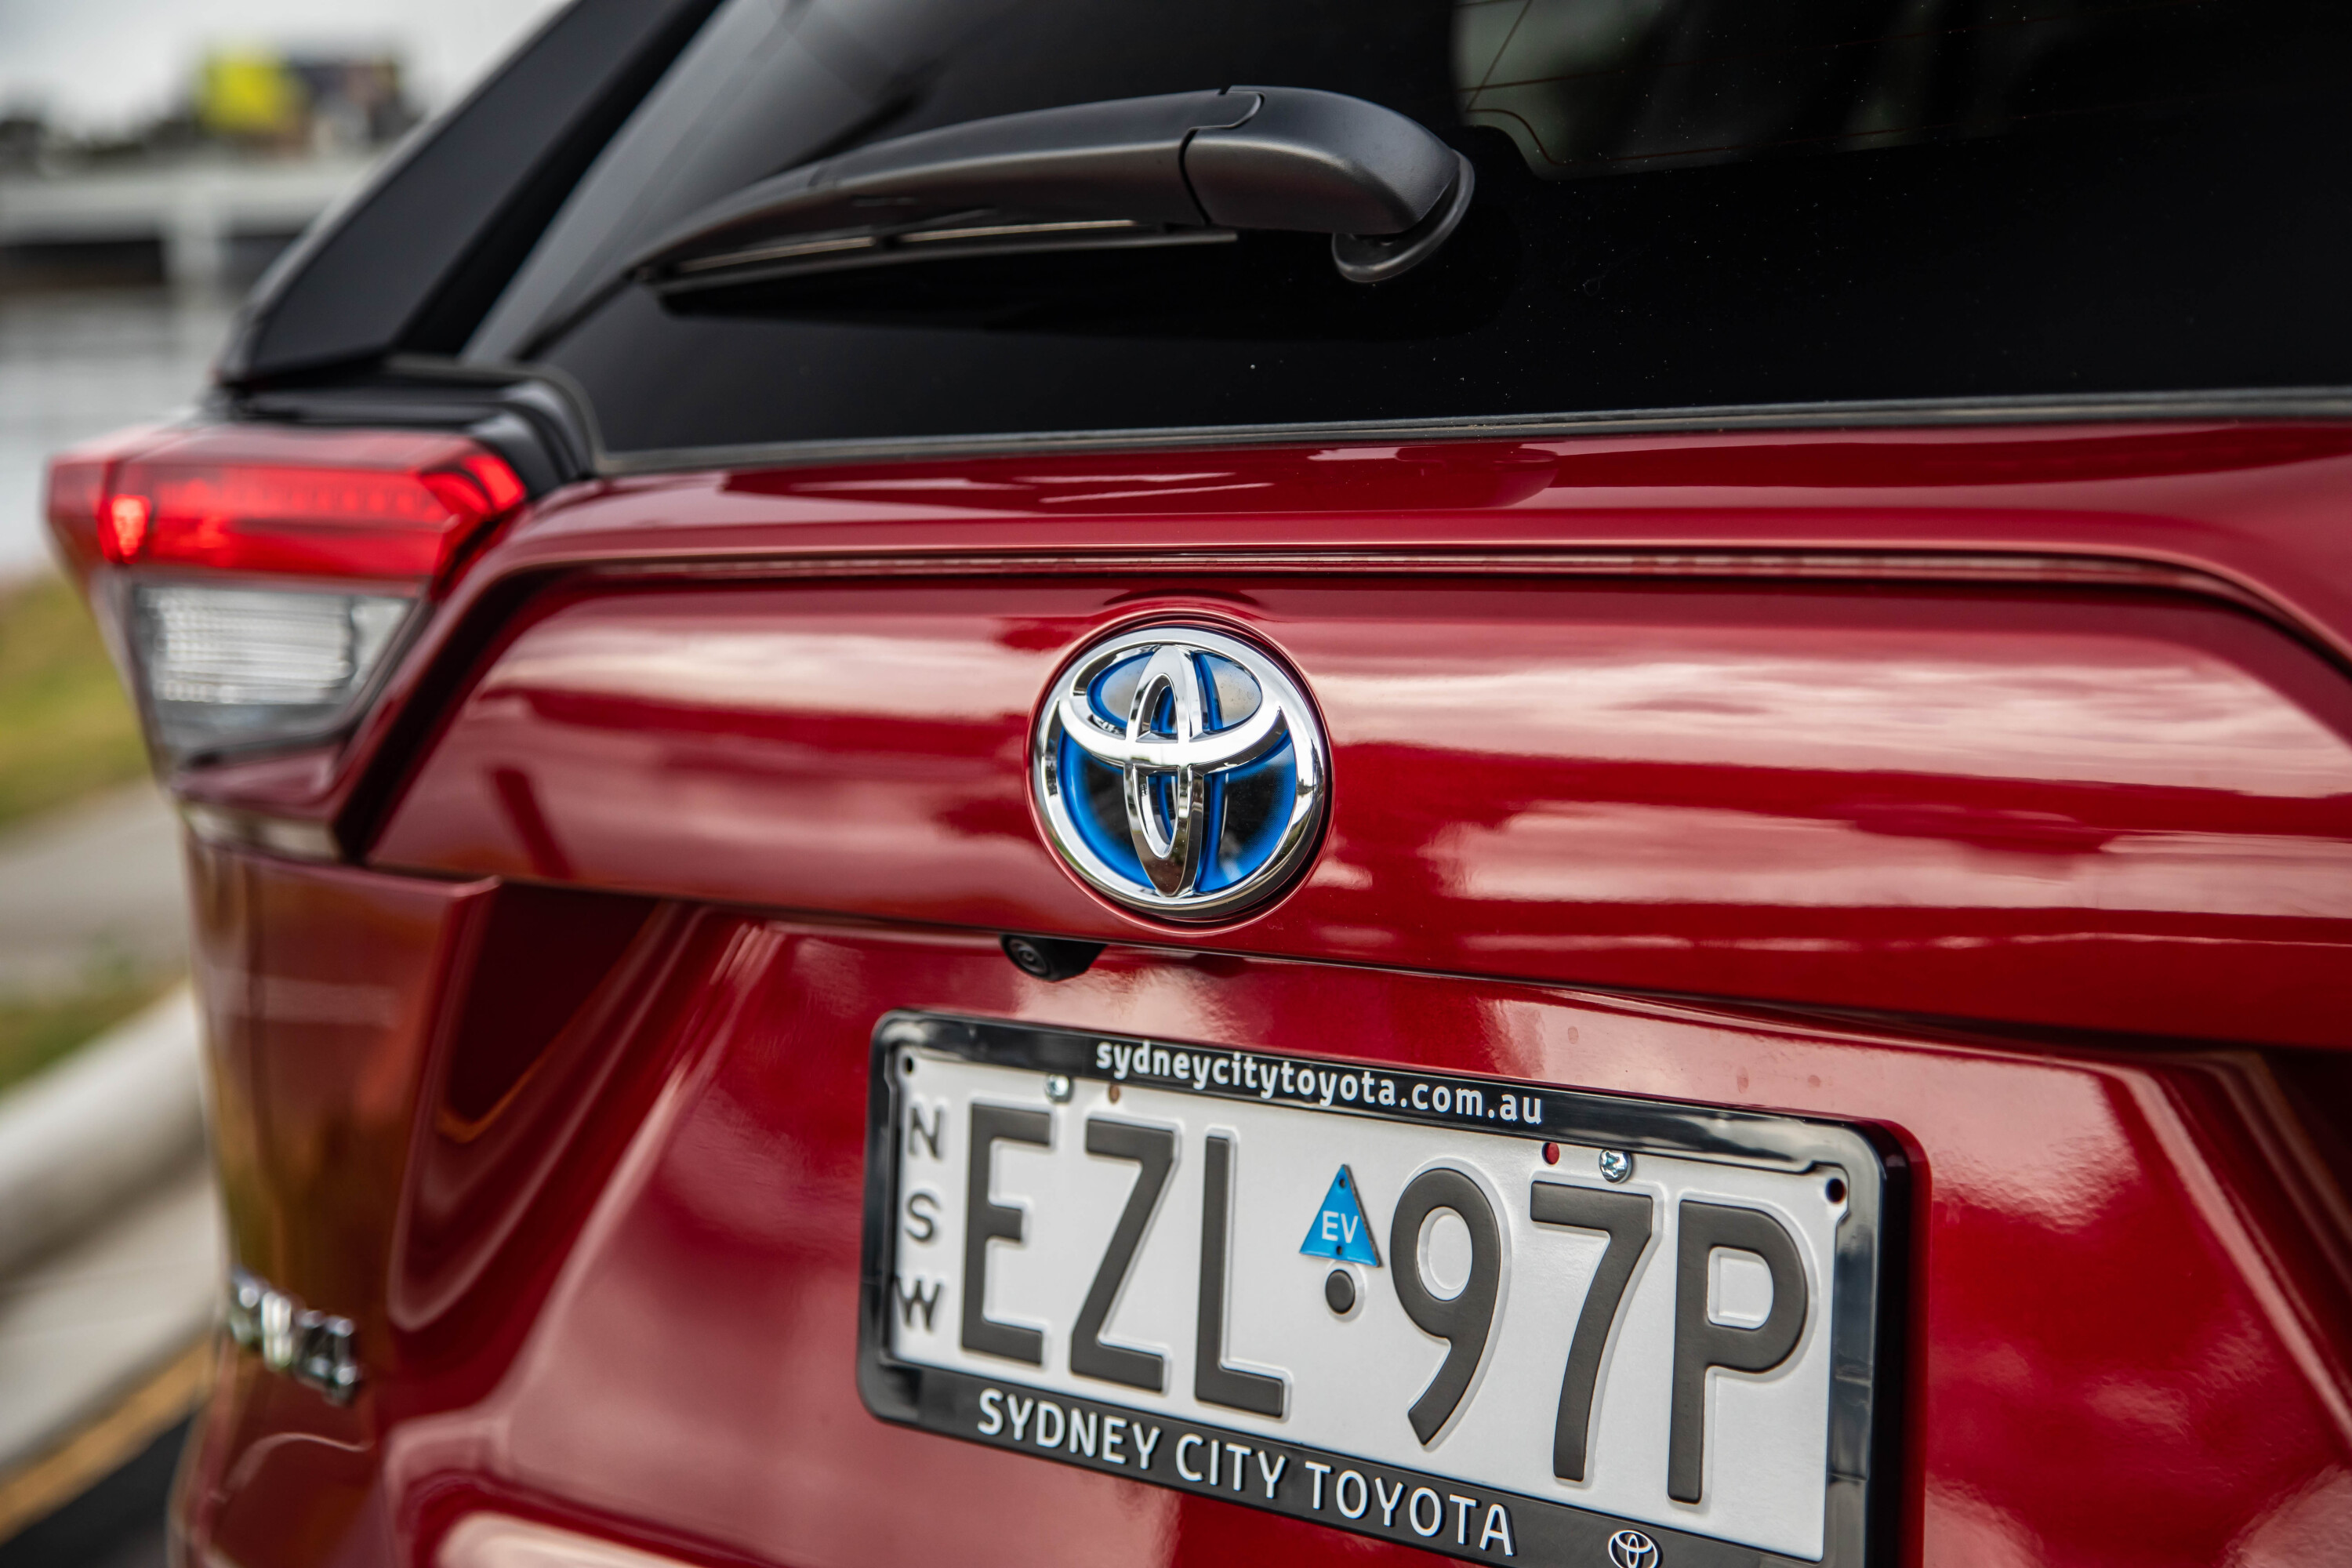
It was a record-breaking month for top-selling brand Toyota with 22,321 sales, beating August 2007 when the brand reported 20,938 vehicles.
1
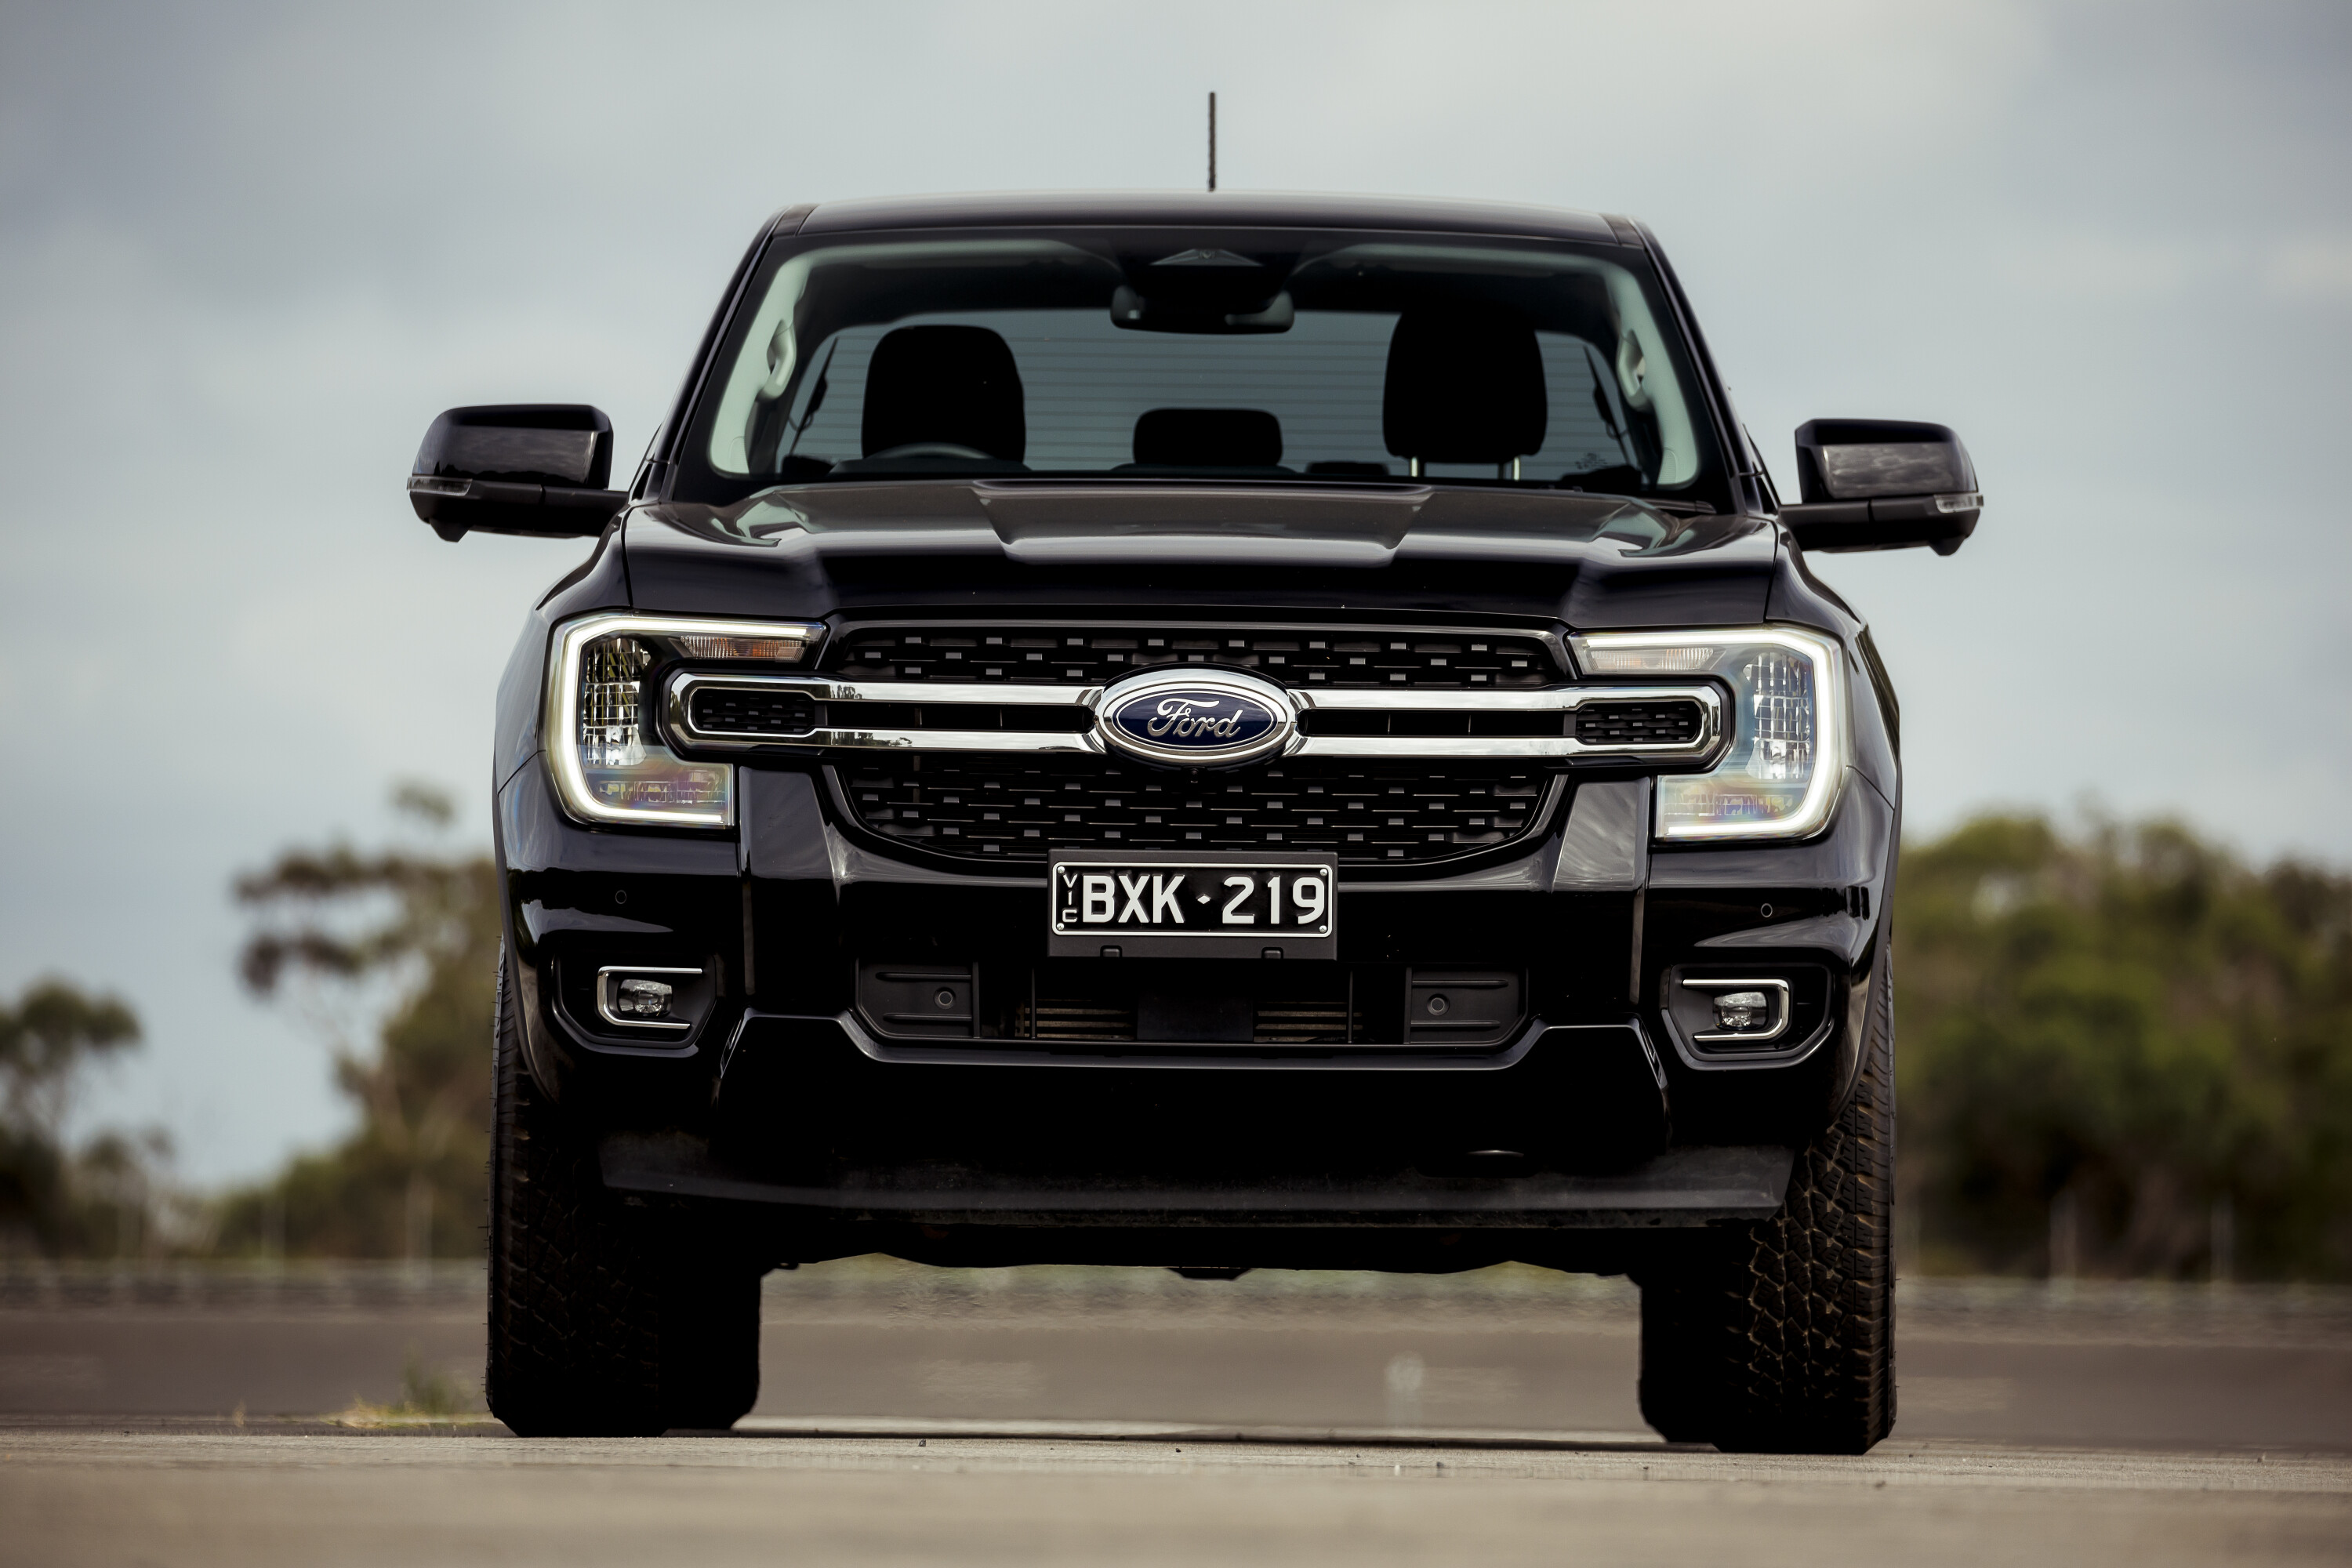
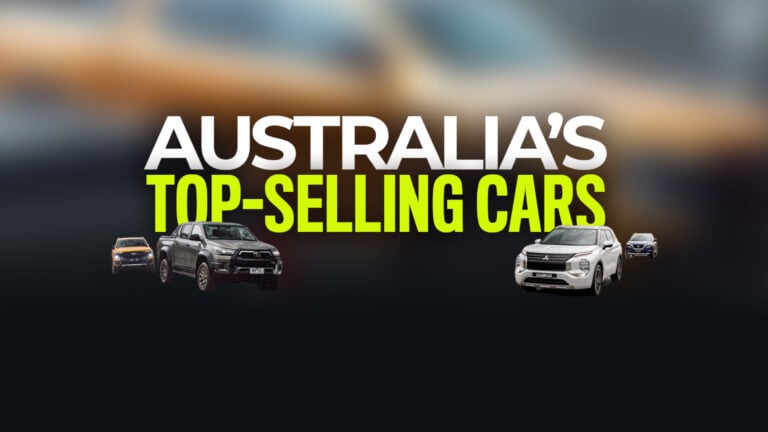
The Toyota HiLux took first place with 5762 units – just two more than the second-place Ford Ranger (5760) as both vehicles continue to fight for a place at the top of the podium.
Year-to-date, 38,525 examples of the Toyota HiLux have been sold in Australia, compared to 37,644 Ford Rangers.
New South Wales registered the most vehicles with 34,655 sales, ahead of Victoria and Queensland with 29,126 and 23,049 sales, respectively.
1
Western Australia (11,637), South Australia (6952), Tasmania (1843), the ACT (1713), and the Northern Territory (991) followed.
The Federal Chamber of Automotive Industries said the record-breaking August reflects “both a high level of demand from Australians and improved supply of vehicles”.
“Year-to-date sales have increased 9.9 per cent which is a better indicator of the underlying strength of the market,” said FCAI chief executive Tony Weber.
“As consumers continue to embrace low emissions technologies we are seeing growth in electric, plug-in and hybrid vehicle sales. More than 1 in 6 vehicles sold in the month of August featured low emissions technologies.”
1
JUMP AHEAD
- Top 10 models
- Top 10 brands
- Sales by segment
- Sales by fuel type
- Sales by country of origin
- Sales in charts
? Australia’s top 10 cars for August 2023
The Toyota HiLux and Ford Ranger were neck-and-neck in August with just two units splitting the first and second spot.
In first place, HiLux recorded 5762 sales – down 7.3% from last year – with the Ranger following with 5760 units, up 28.1% from August 2022.
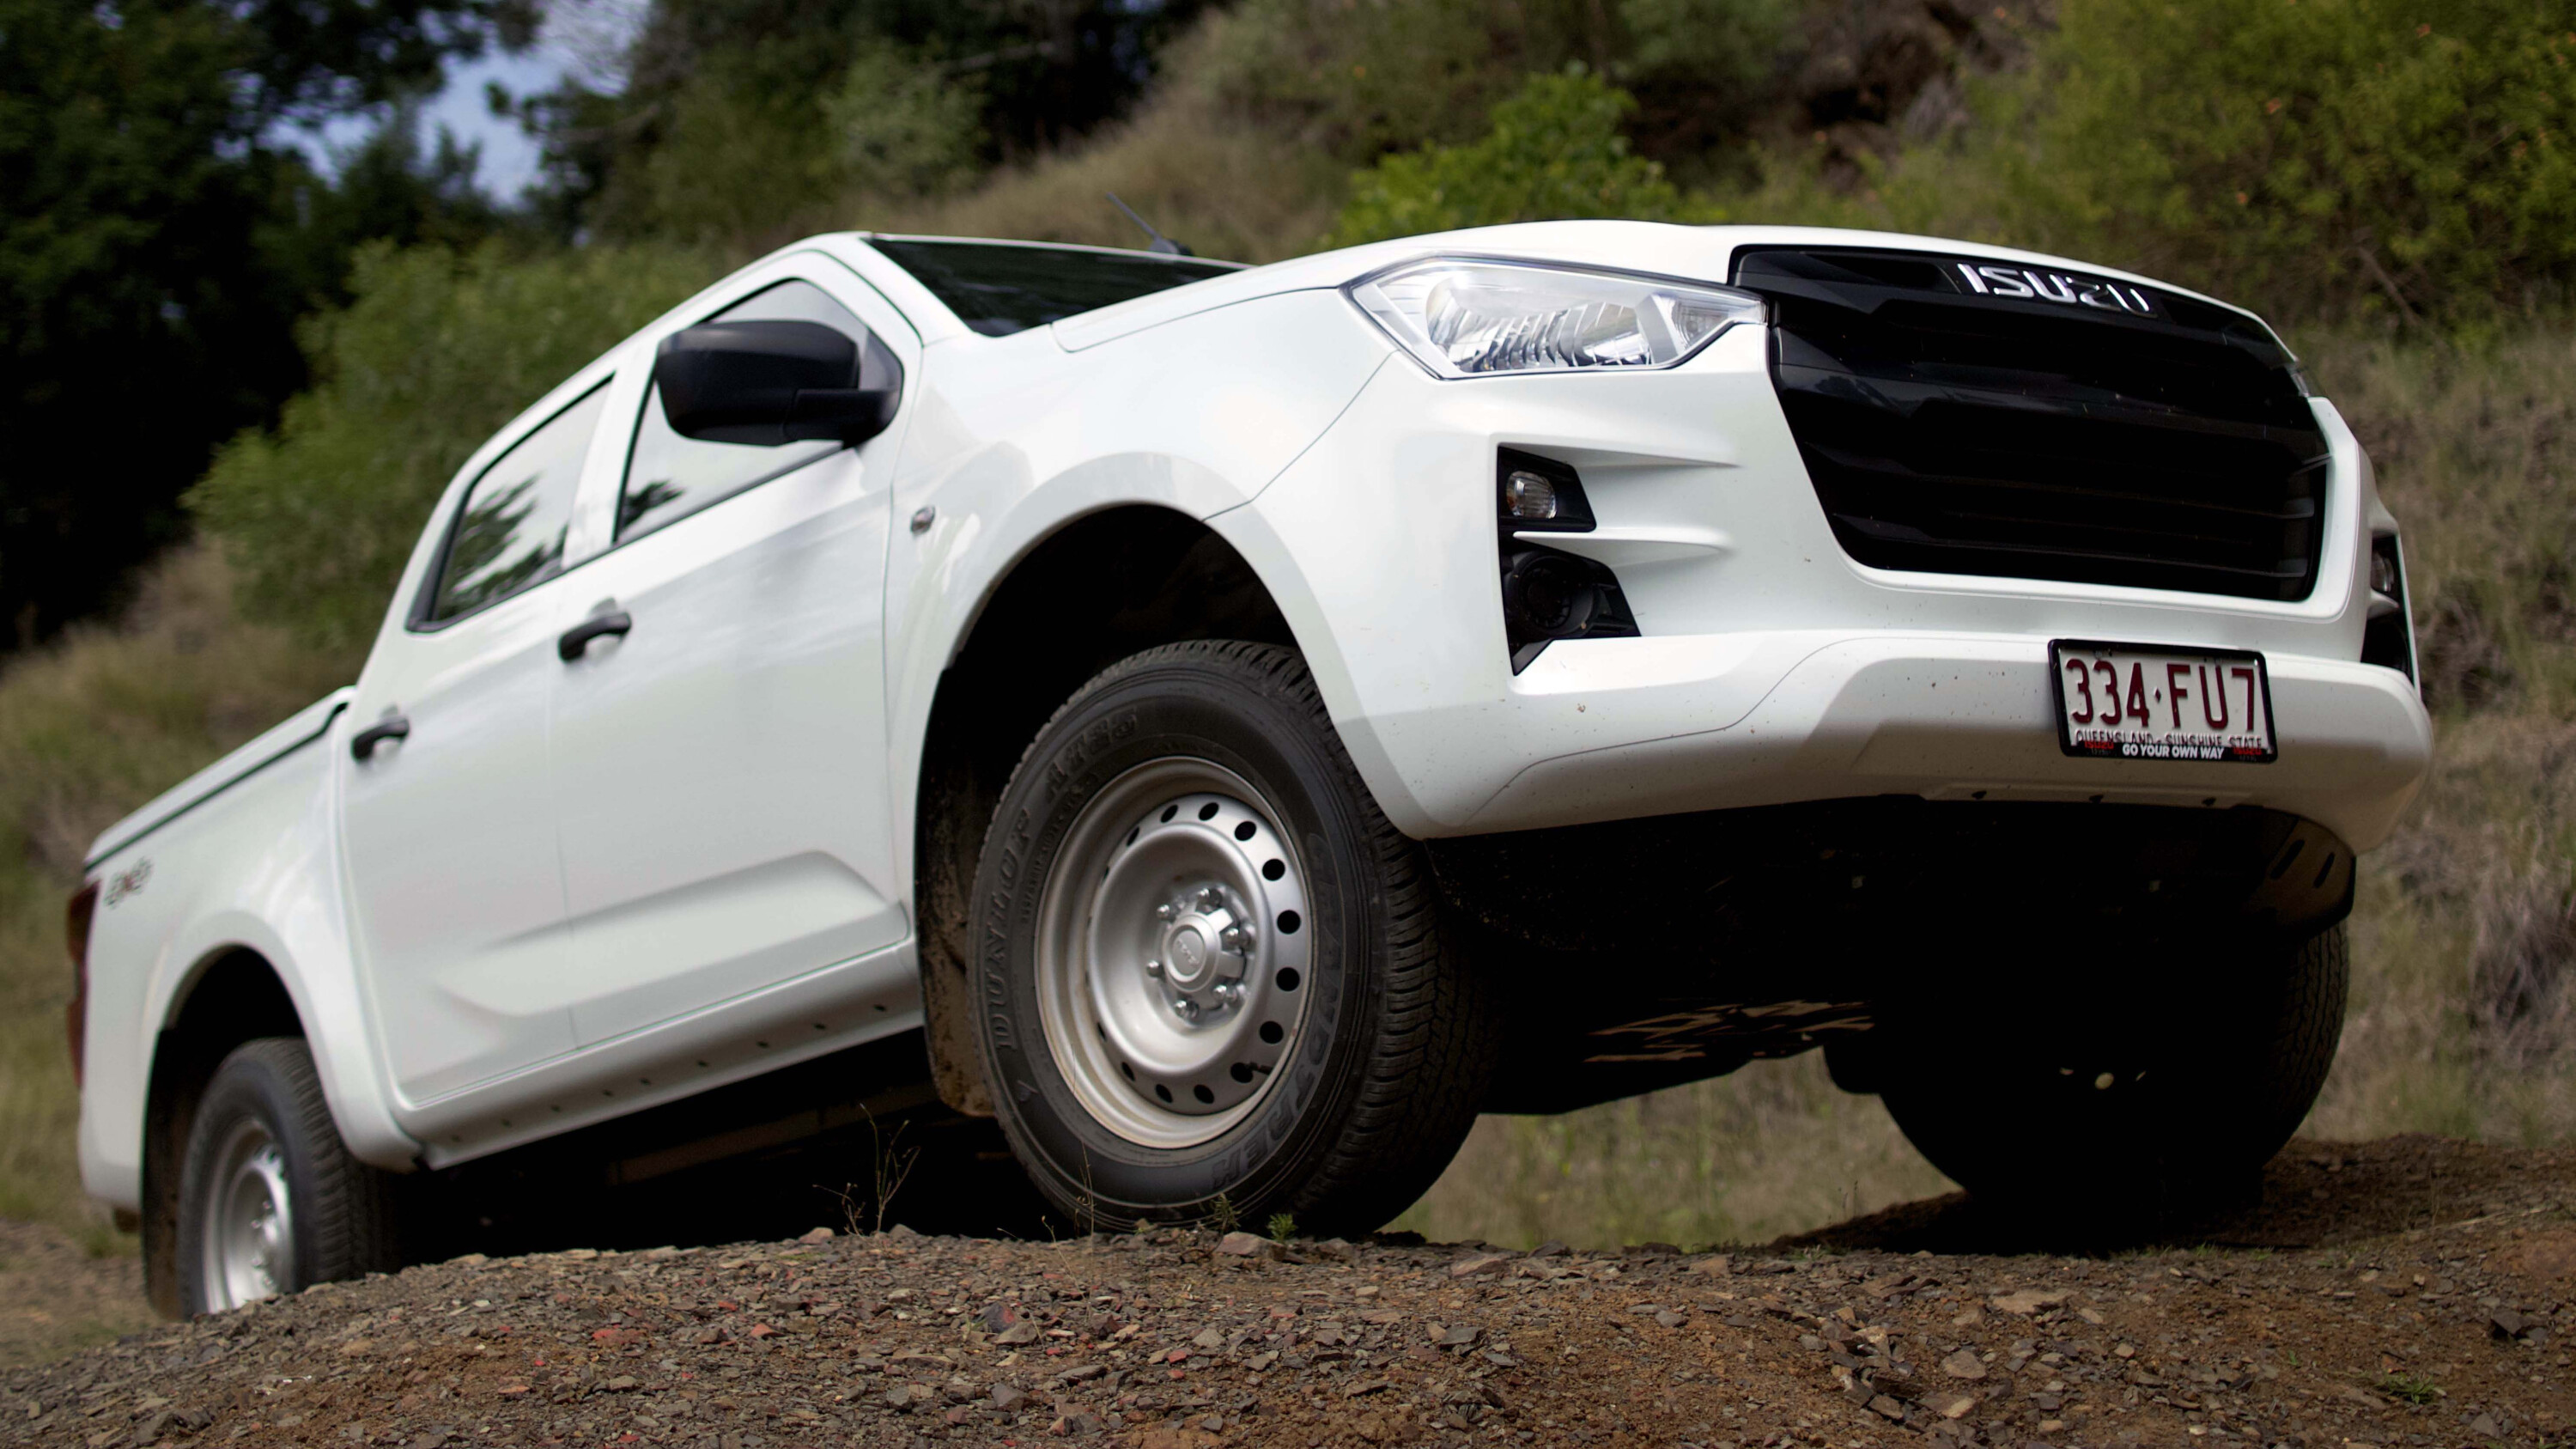
The Toyota RAV4 took bronze with 3317 sales while the Isuzu D-Max followed in fourth place (3281).
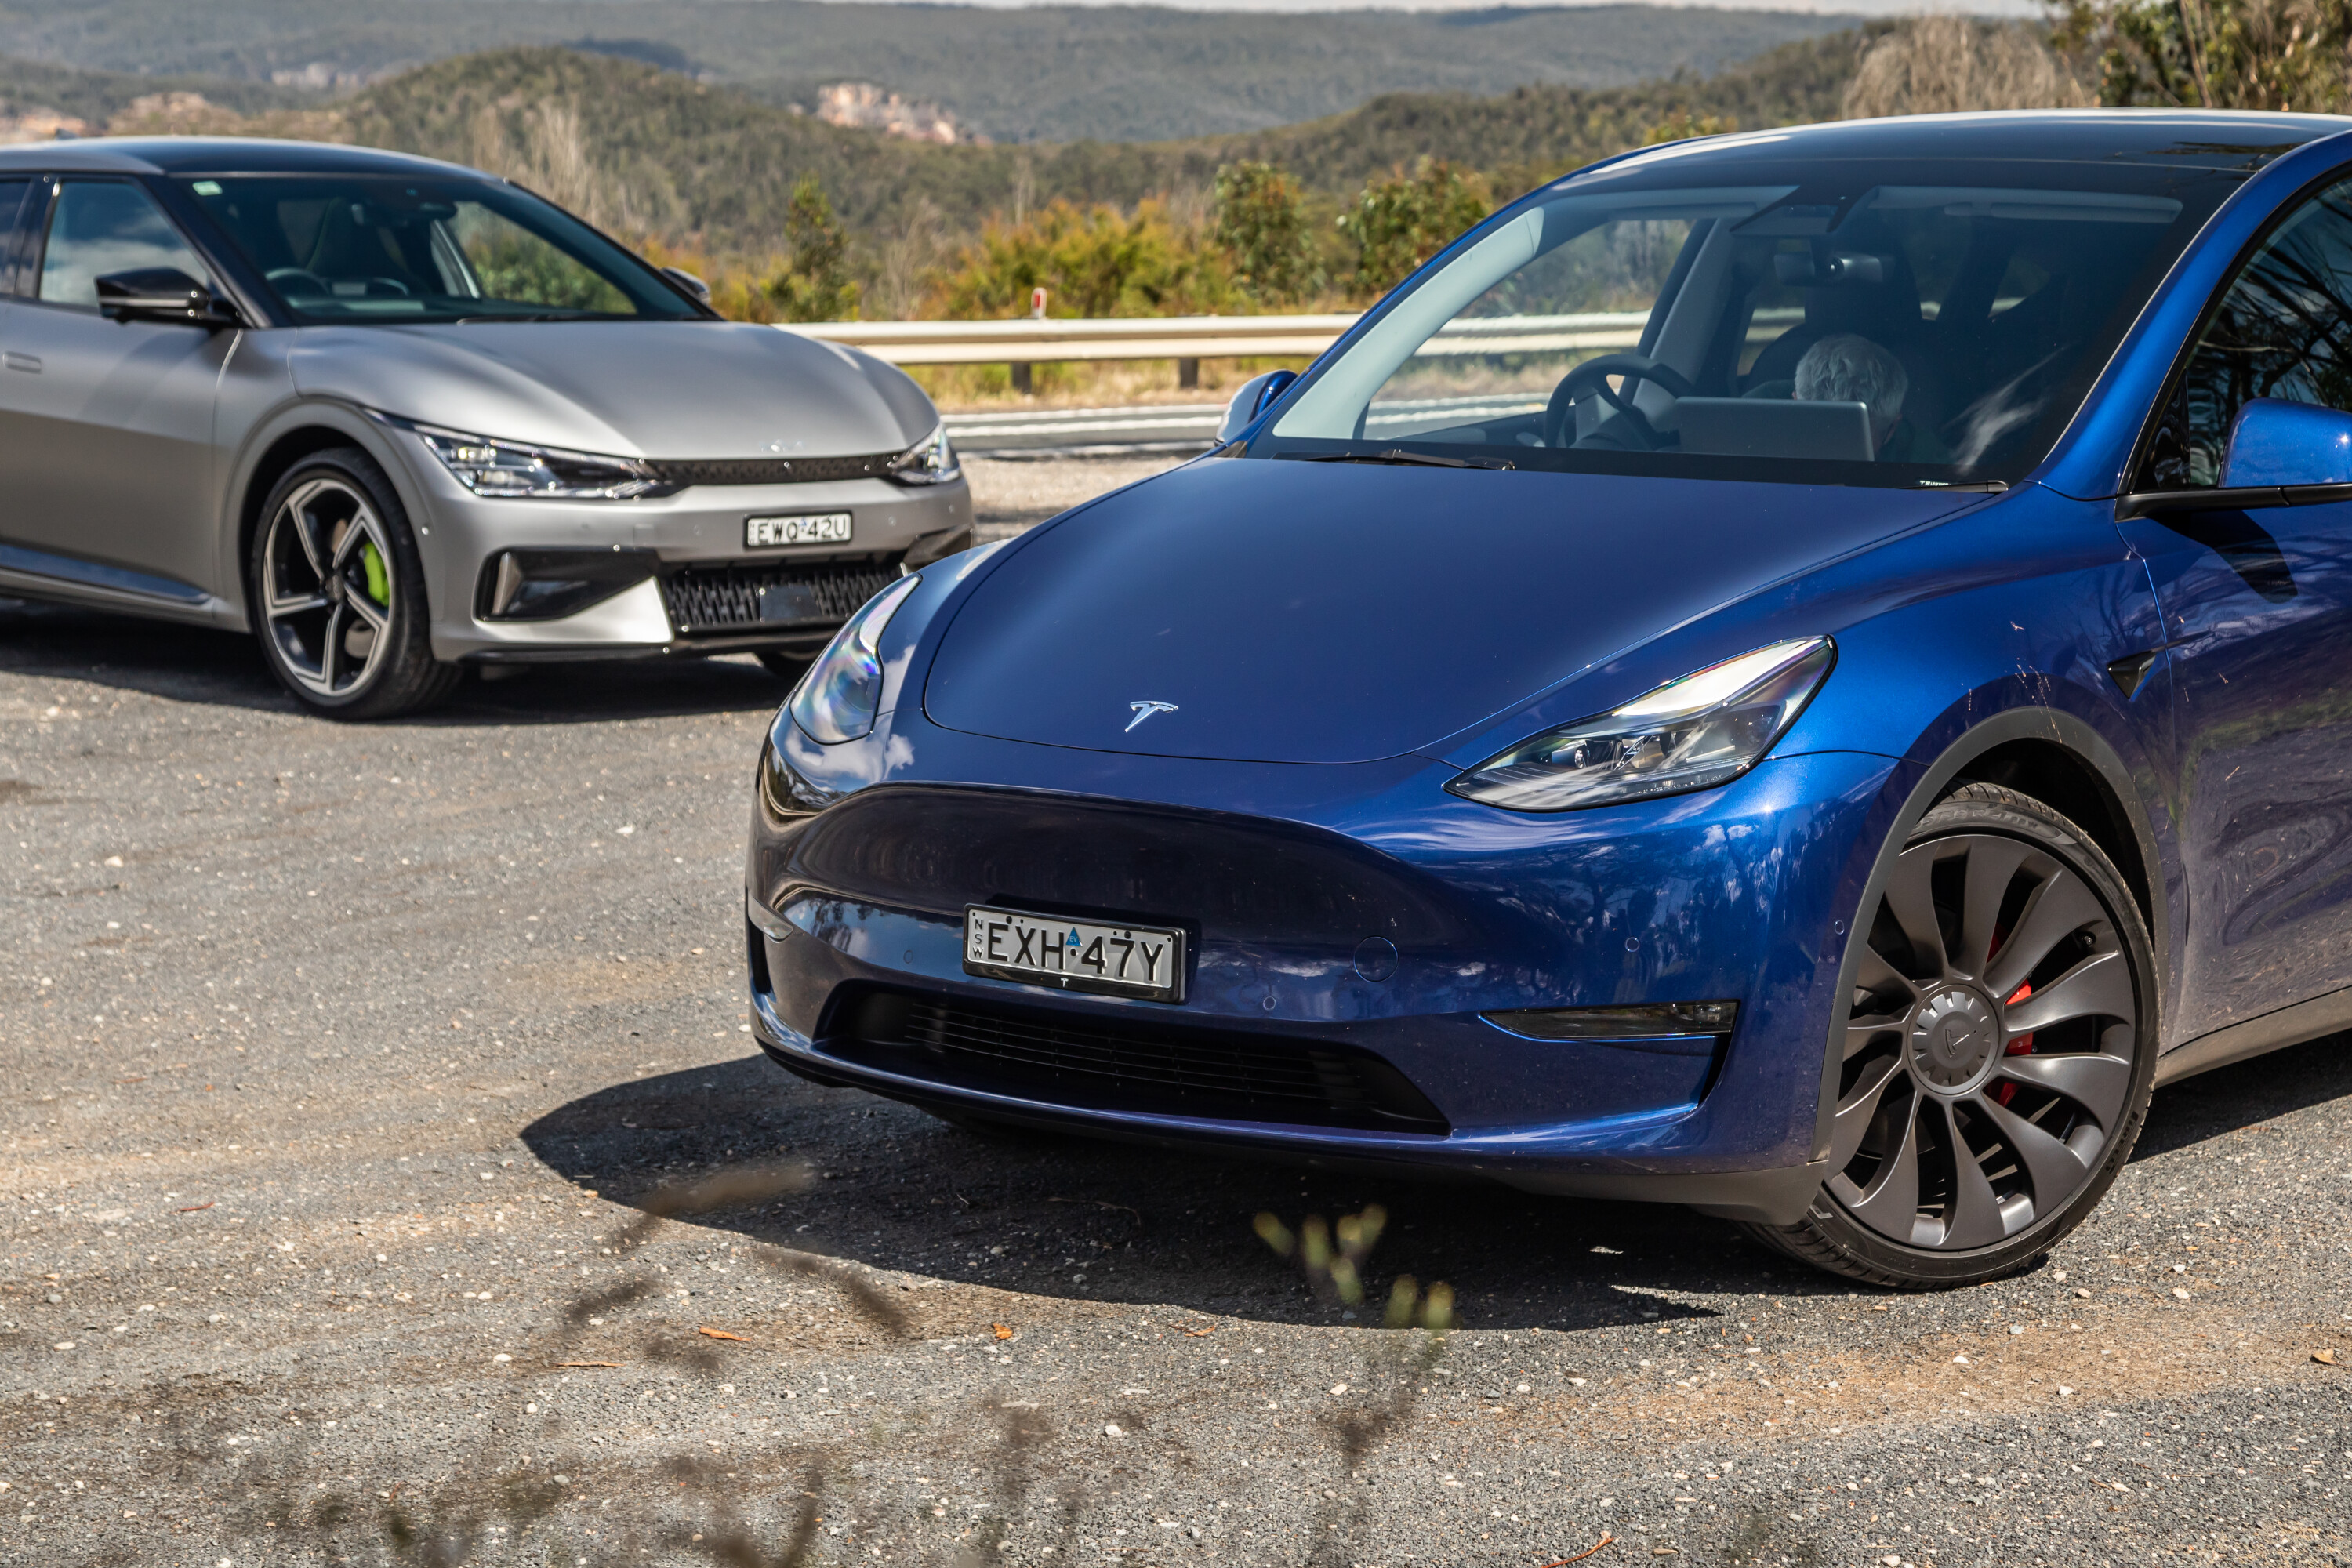
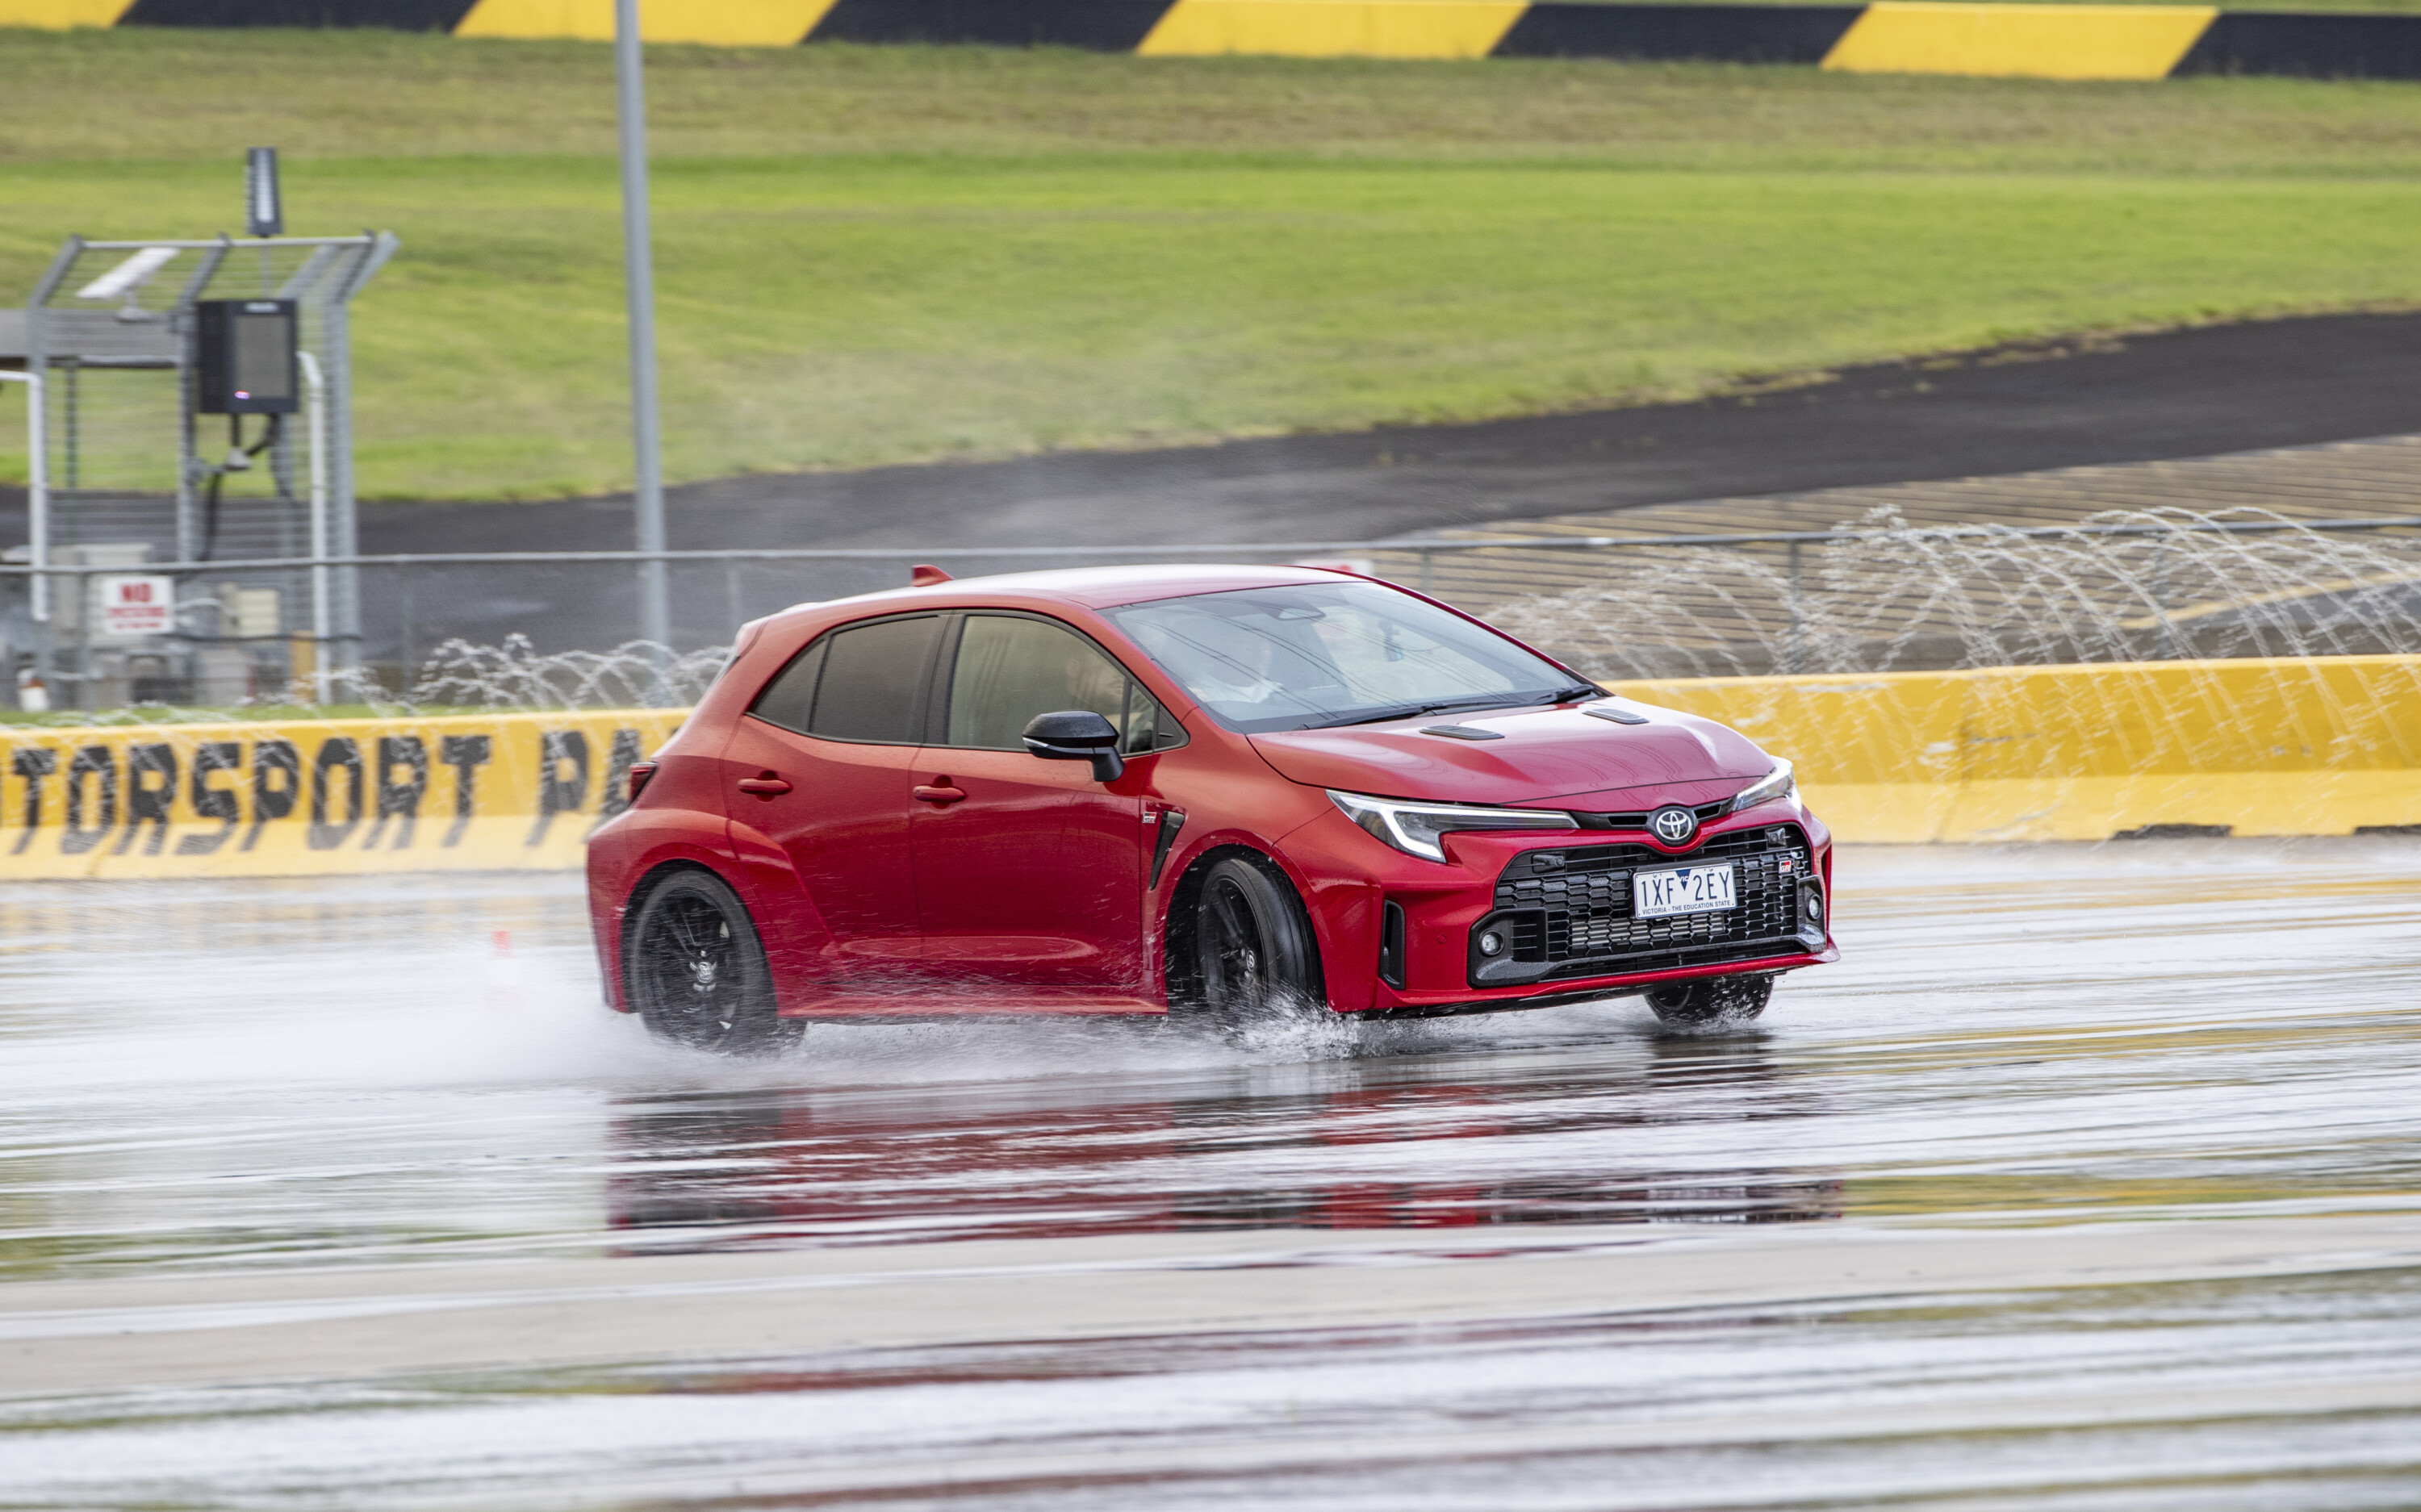
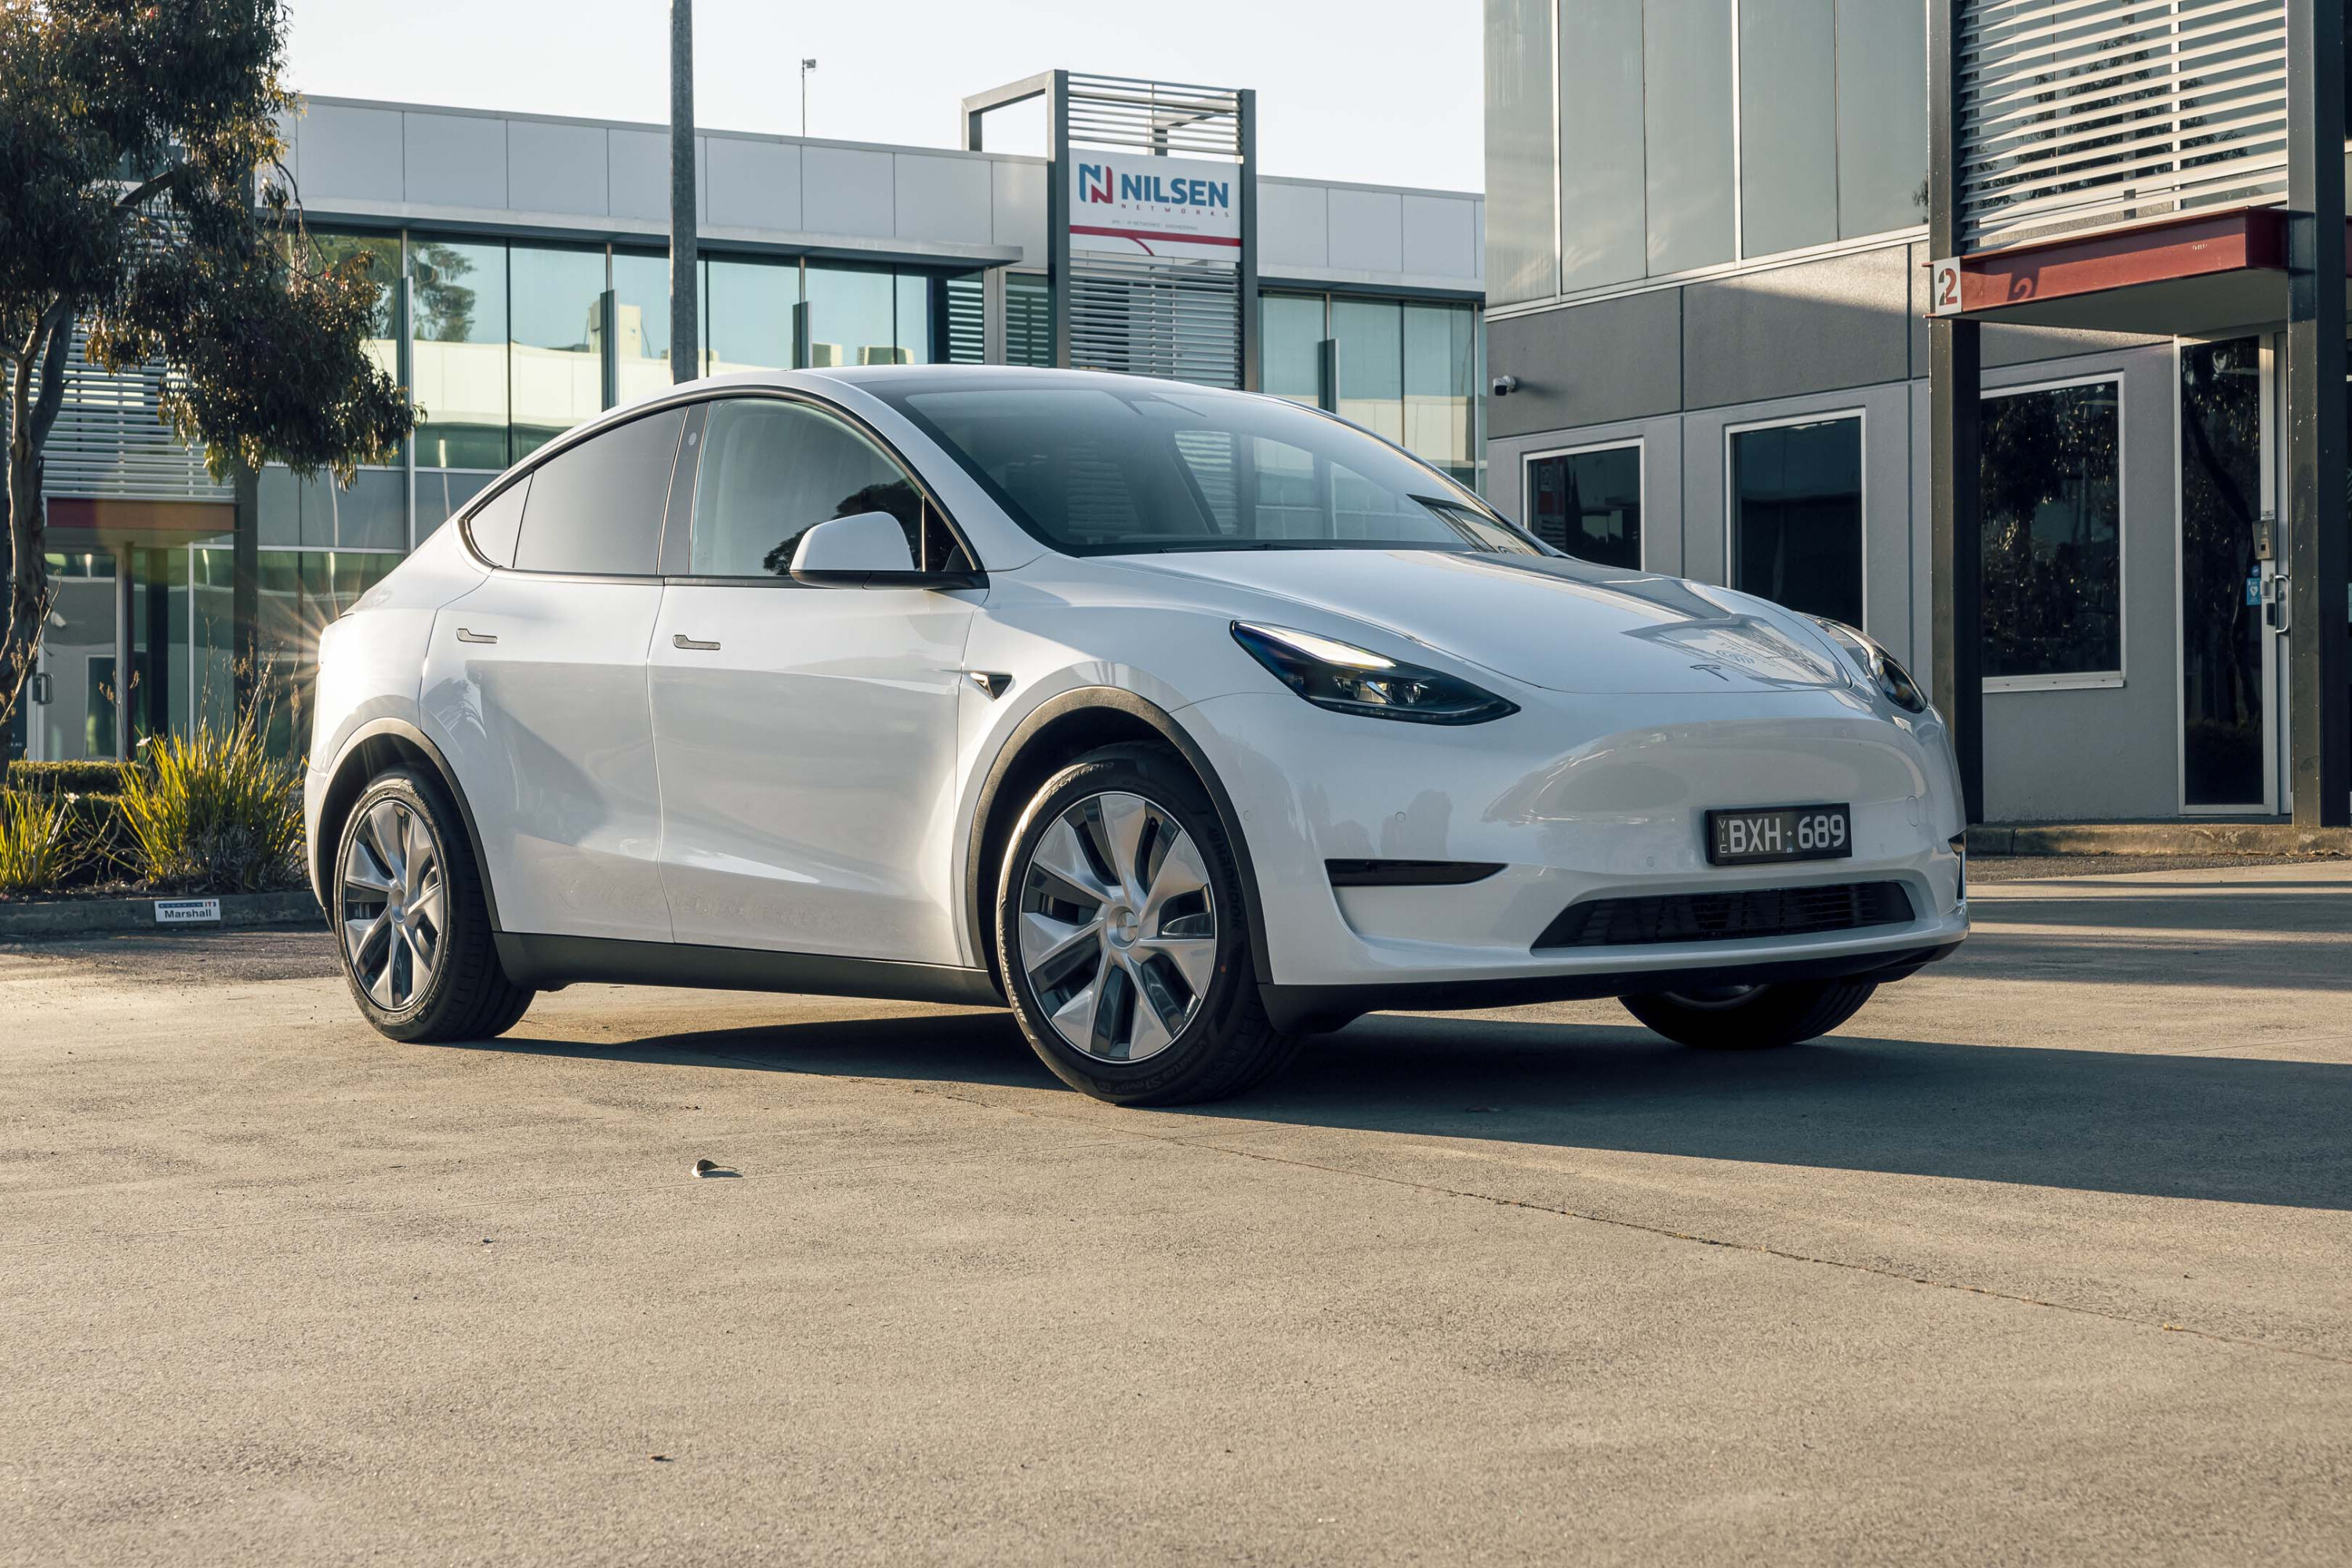
China’s MG ZS small SUV placed fifth (3193), followed by the Toyota Corolla (2808) and electric Tesla Model Y (2314).
1
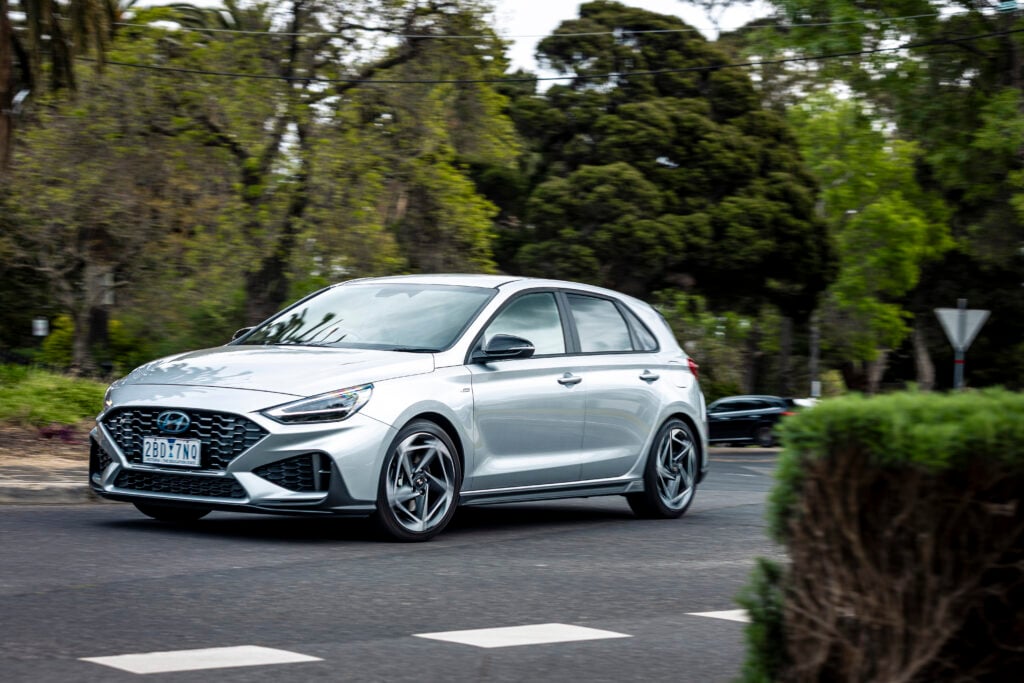
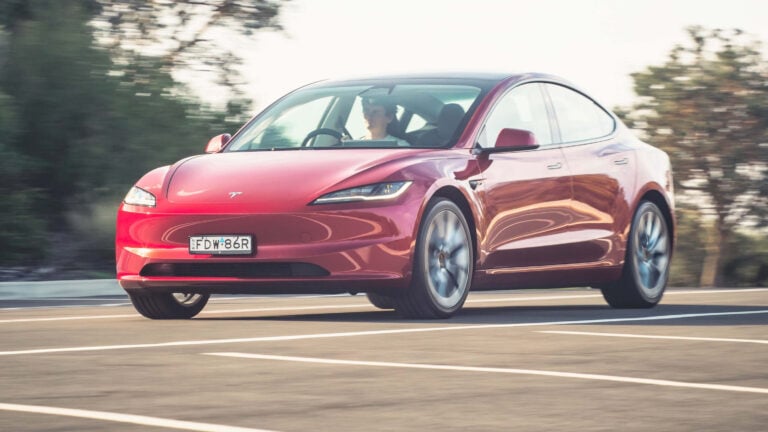
The Toyota Corolla was the only passenger vehicle in the top 10 in August, while its 12,068 registrations year-to-date place it behind the Hyundai i30 (14,844) and Tesla Model 3 (13,174).
The Hyundai Tucson was the nation’s eighth best-seller (2314), the Mitsubishi Outlander placed ninth (2030), and the soon-to-be-replaced Toyota LandCruiser Prado took 10th place (1969).
Frequently placed vehicles missing from the top 10 in August include the Mazda CX-5 (1784) and Hyundai i30 (1765), while other vehicles in the top 20 include the Subaru Outback (1654), Toyota LandCruiser wagon (1641), Nissan X-Trail (1533) and Ford Everest (1502).
1
1
? Australia’s top 10 car brands for August 2023
Ups and downs ? ?
Toyota recorded a record month with 22,321 sales (▲ from 20,616 in August 2022). Year-to-date, the Japanese brand’s sales are down 17% at 133,747, representing 17% of the market.
Mazda finished second with 8458 sales (▼from 8824), while Ford recorded 7898 sales (▲ from 5839) due to strong Ranger and Everest demand.
Hyundai, in fourth, recorded 6513 sales in August (▼ from 6780), while Kia took fifth with 6510 sales (▼ from 6643).
1
Year-to-date, Kia remains narrowly ahead of its Hyundai parent, with 51,820 sales compared to 50,741.
Chinese marque MG followed in sixth with 5368 sales (▲ from 3074), Mitsubishi placed seventh with 4961 sales (▼ from 6780) and Isuzu Ute, in eighth, recorded 4712 sales (▲ from 2800)
Subaru placed ninth with 4706 sales (▲ from 2960), while Nissan returned to the top 10 in August with 4233 sales (▲ from 2960, or 154%), thanks to high X-Trail and Patrol sales.
Electric car brand Tesla fell to 12th place in August with 3309 sales after posting a record result in June, when 7018 sales were reported.
1
1
Size & Shape: Market segment results for August
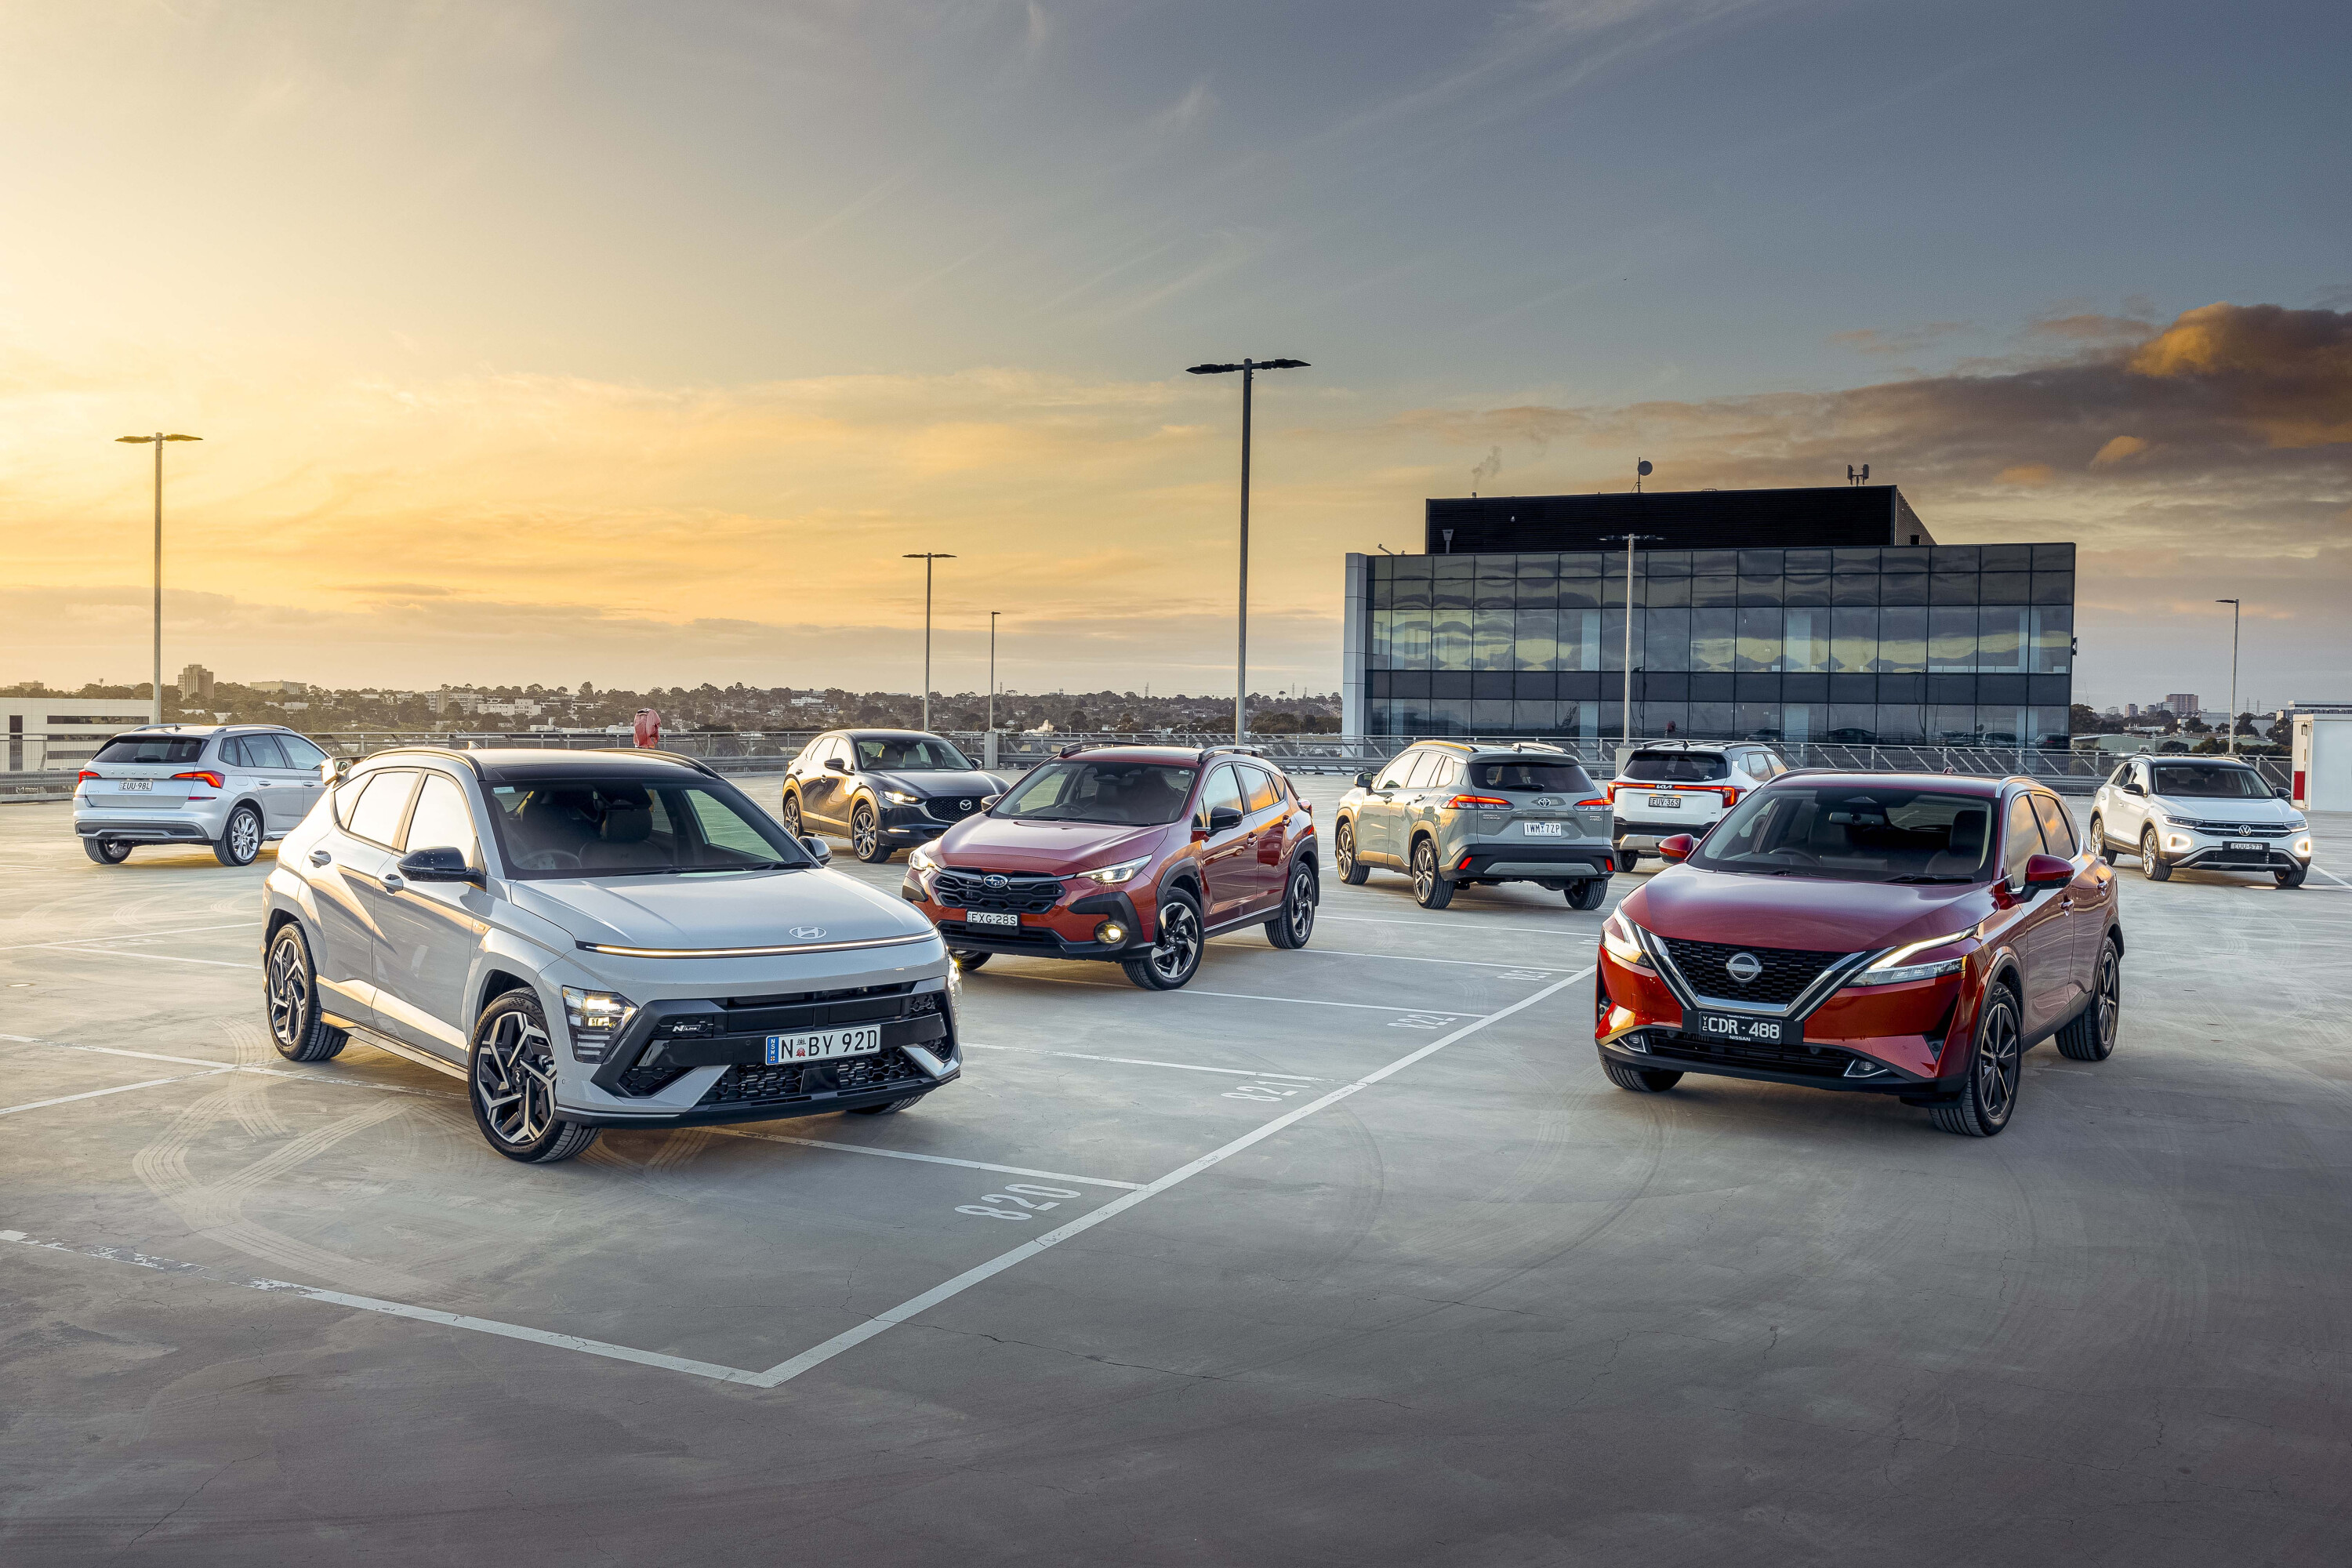
In August, SUVs, utes and vans represented 79% of the new-car market.
In total, 62,313 SUVs were sold from light to upper large, taking 58% of the total, followed by utes and vans with 24,031 sales in June, or 22%.
Mid-size SUVs dominate with 23,862 sales, followed by 4×4 utes and small SUVs with 18,626 and 18,626 sales, respectively.
Combined ute sales were 22,306 including 4x2s and large American pick-ups.
Passenger car sales continue to decline with 19,336 sales in August – equating to an 18% share, down from 21% in August 2022.
Small cars represented 8% of the total market, while the medium segment fell to 4% – down from 5% – with less Tesla Model 3 electric sedan sales.
1
1
August 2023: New-car sales by fuel type
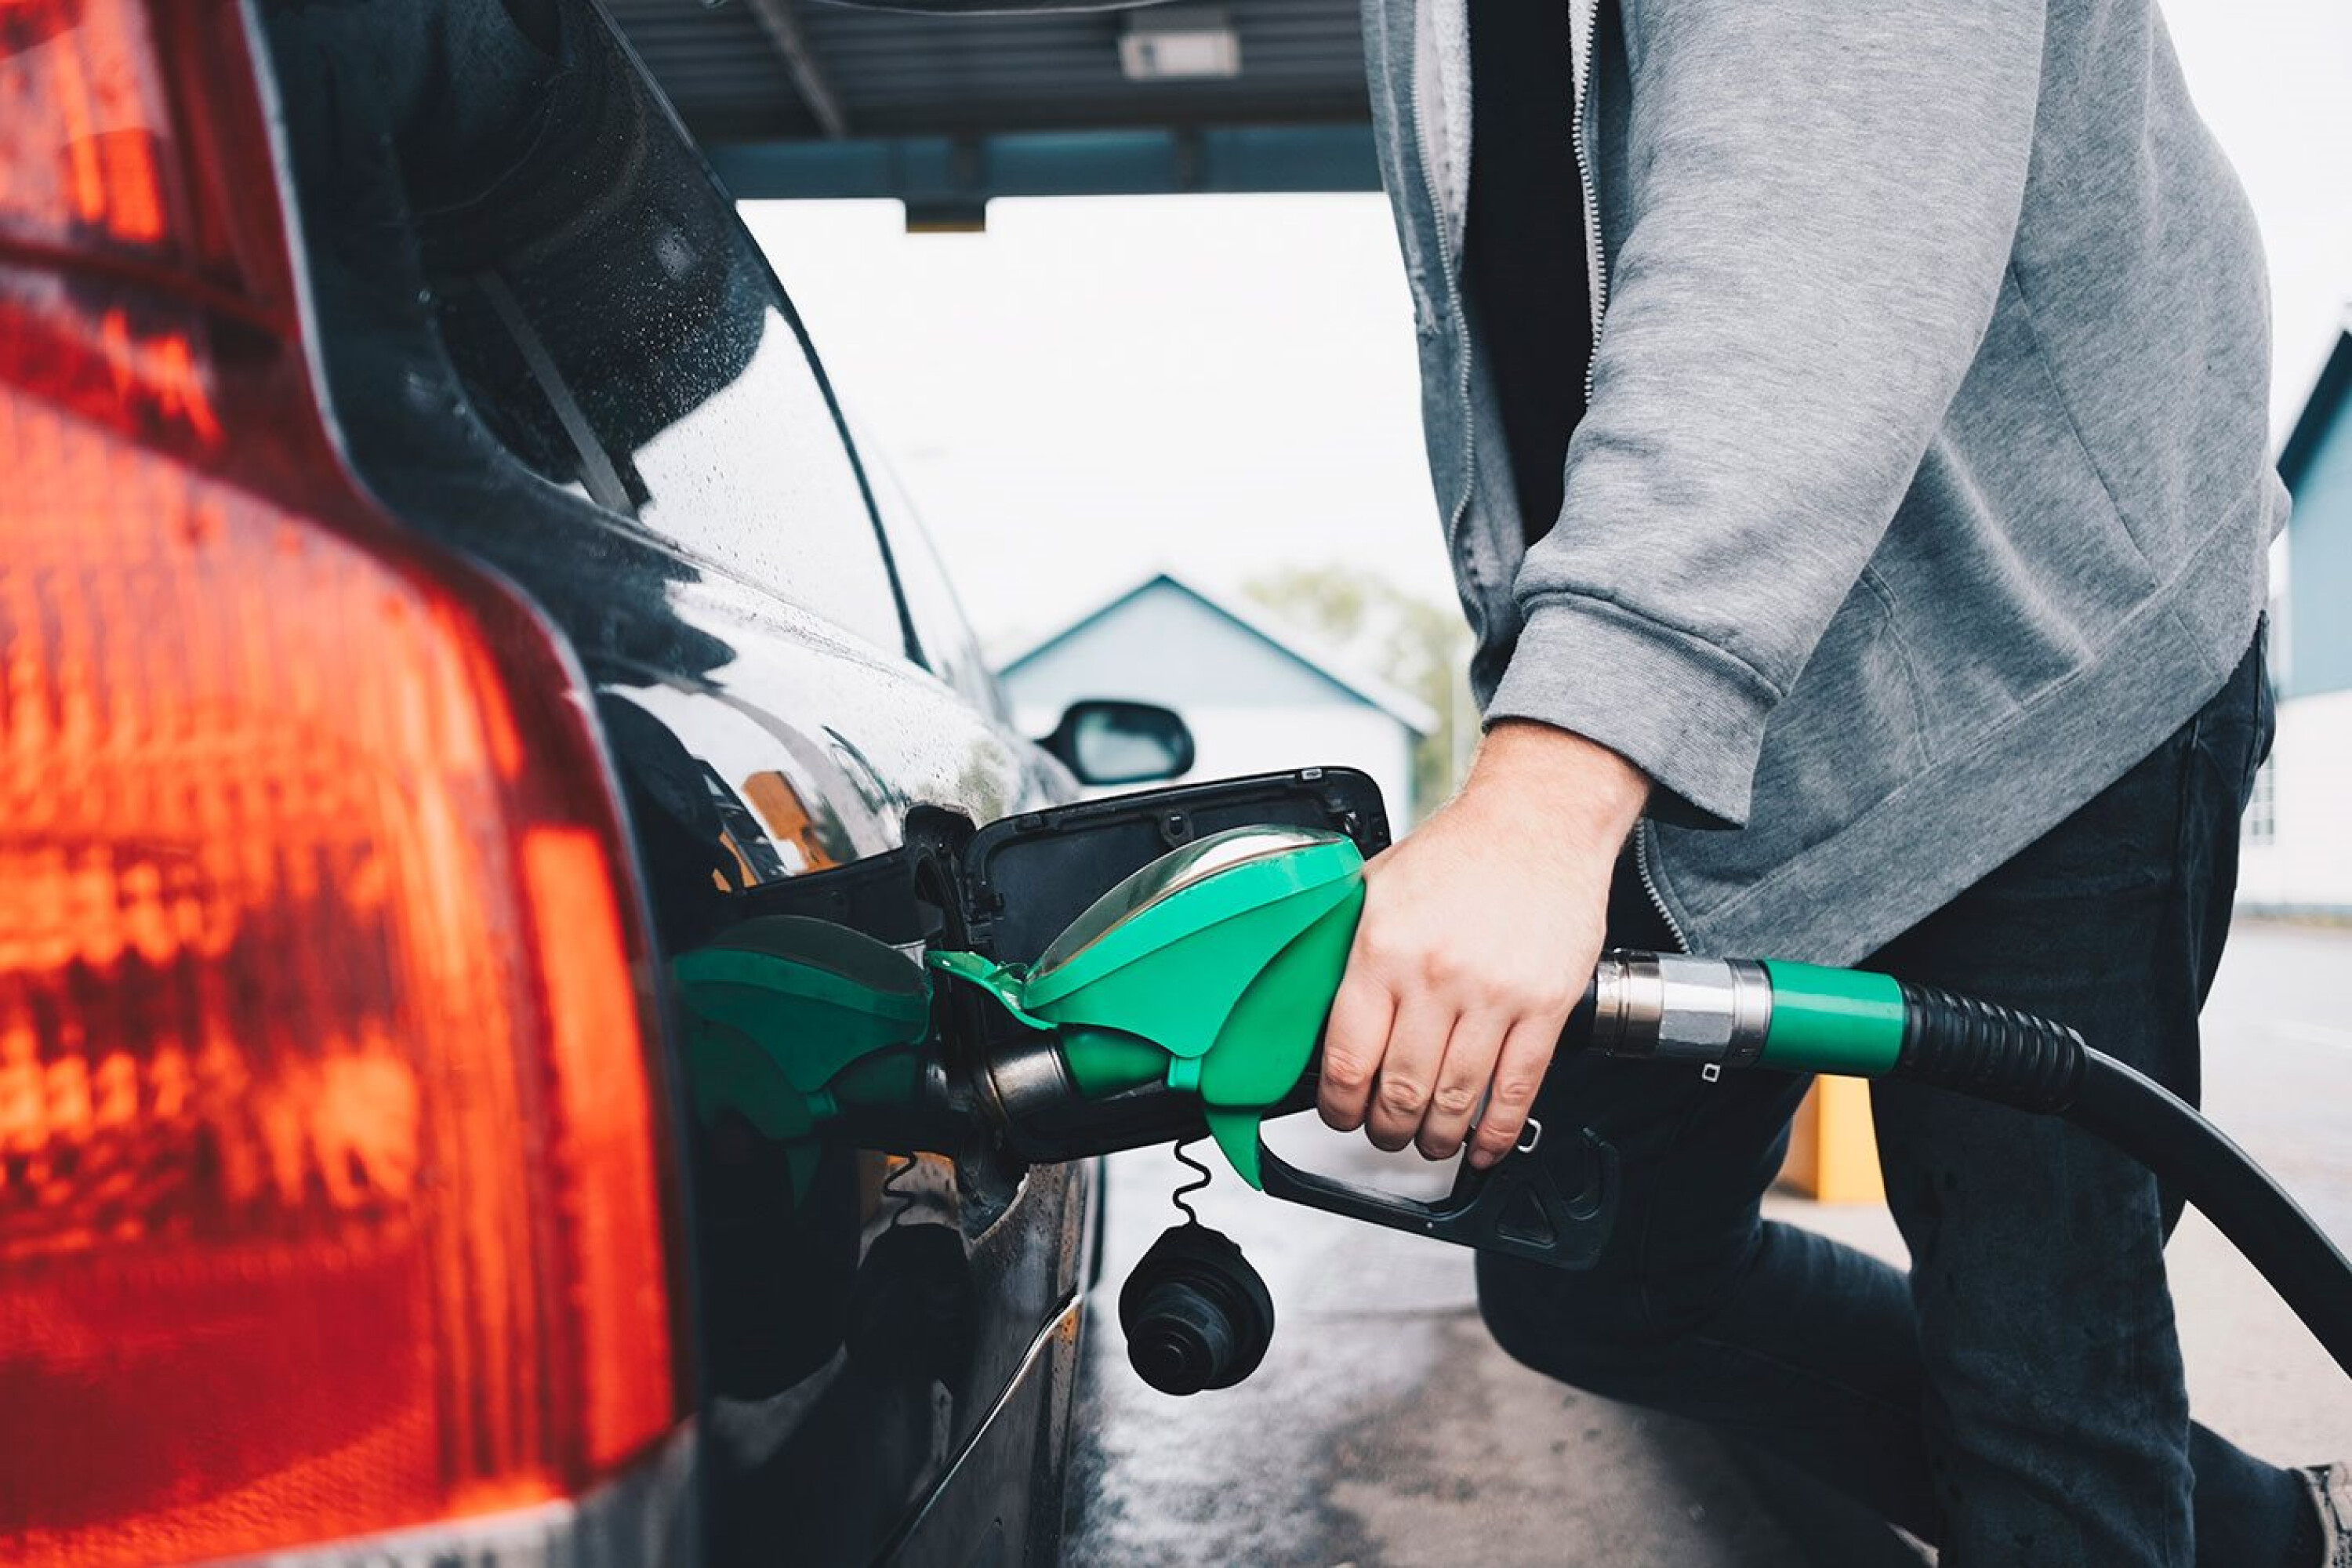
Petrol remained the default choice for Australian new-car buyers, with an 8% bump over last August to 52,407 sales.
Diesel was second best – up 9% with 33,590 sales – while 11,584 traditional hybrids were reported as sold, up 69%.
Electric vehicle sales continue to rise with 6,984 sales, up 65% compared to last August and 292% year-to-date.
Plug-in hybrid vehicles accounted for 1113 sales – up 106% – and two new hydrogen vehicles were registered in August, taking its YTD total to 10.
1
1
Country of Origin: Where Australia’s new cars came from in August 2023
Japan remains Australia’s number one source of new cars followed by Thailand, while Chinese cars outsold Korea in third place.
Australian new-car buyers bought 35,945 Japanese-built cars in August, up from 29,147 at the same time in 2022.
Thailand – where most utes and ladder-frame SUVs are produced – followed with 23,095 cars (▲ from 19,880).
China placed third ahead of Korea (16,150 compared to 13,763).
Automotive News Europe [↗] reports China overtook Japan for new-vehicle exports in the first half of 2023 to become the world’s largest vehicle export country at 2.34 million vehicles – up 77% over the same time in 2022 – versus 2.02 million.
Germany trailed in fifth with 5413 registrations last month, followed by undefined countries (3247) and the United States (2768).
In charts ?
August 2023 – Top 20 models
August 2023 – Top 10 brands
August 2023 – Overall segment sales
August 2023 – Category sales
August 2023 – sales map
August 2023 – buyer type
August 2023 – Model sales race
MORE
All VFACTS stories
Follow WhichCar/Wheels on Google
Click the button below to make WhichCar by Wheels a preferred source for your news.
We recommend
-
 News
NewsThese were Australia's top 10 best-selling cars in 2023
It's no surprise that Australians love the Toyota HiLux and Ford Ranger, but rising EV demand and supply constraints wrote an interesting tale for the nation's top 10 best-selling cars in 2023
-
 News
NewsAustralia's most popular electric cars in 2023
The results are in: Australians purchased more EVs than ever in 2023 and Tesla ruled the roost
-
 News
NewsNew car calendar 2026: All the new cars coming to Australia
Here’s the WhichCar by Wheels guide to all the new cars that will launch in Australia in 2026. Check back in regularly for updates...