Advice

Gallery 1
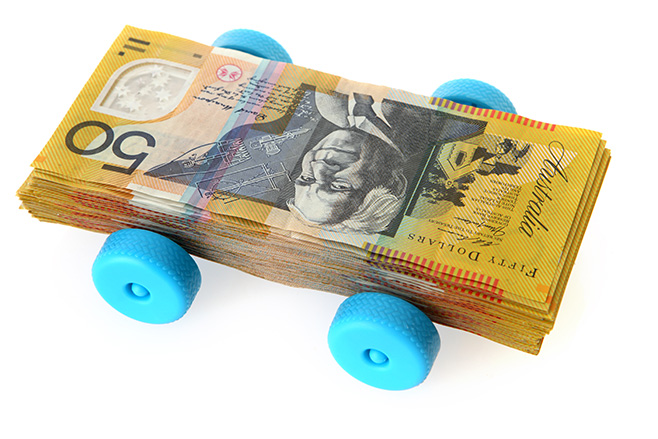
A NEW transport affordability study has found Australian families are spending more than $22,000 per year on transport, including the cost of running two cars, with Sydney being the most expensive capital city to get around.
Australia’s first Transport Affordability Index commissioned by the Australian Automobile Association (AAA) analyses tax, fuel, tollways, public transport, insurance, and finance costs as a proportion of average household income across states and territories.
AAA Chief Executive Michael Bradley said the index found that a significant amount of average household budget in capital cities is being taken up by transport costs, with people living in Western Sydney hit hardest.
“The Index initially shows around 13 percent of an average household budget in most capital cities is spent on transport, which is remarkable when you consider that electricity, water, and telecommunications costs account for only one to three percent of income combined,” Mr Bradley said.
1
“The average household will spend $14,000 a year on transport in Hobart, but up to $22,000 a year if they live in Western Sydney.”
The Index is based on the incomes and transport costs of households in hypothetical middle and outer ring suburbs in each capital city. Each household consists of a couple with children and two cars and assumes that one member of the family drove to work, while the other caught public transport during the second quarter of this year. Prices were compared to the first quarter.
The Index found that Sydney households continue to face the highest transport costs of any city in Australia both in dollar terms and as a percentage of household income, by a wide margin.
A typical two-car Sydney household faced weekly transport costs of $419 per week in the second quarter of 2016 ahead of Brisbane and Melbourne (at $376 and $348 per week respectively). There were followed by Perth ($301), Canberra ($300), Darwin ($286), Adelaide ($286) and Hobart ($271).
Transport costs as percentage of household income in Sydney was 16.8 percent, 3.5 per cent above the national average. Brisbane was next highest with 15.9 per cent followed by, Hobart (14.2%), Melbourne (14.1%), Adelaide (13.2%), (Darwin 12%) and Perth (10.1%).
Brisbane’s household transport costs were higher than Melbourne’s on the back of higher public transport and fuel costs. Brisbane’s weekly public transport spend was $65.43 in the second quarter, $25 more than the national average.
Follow WhichCar/Wheels on Google
Click the button below to make WhichCar by Wheels a preferred source for your news.