Advice
Gallery 1
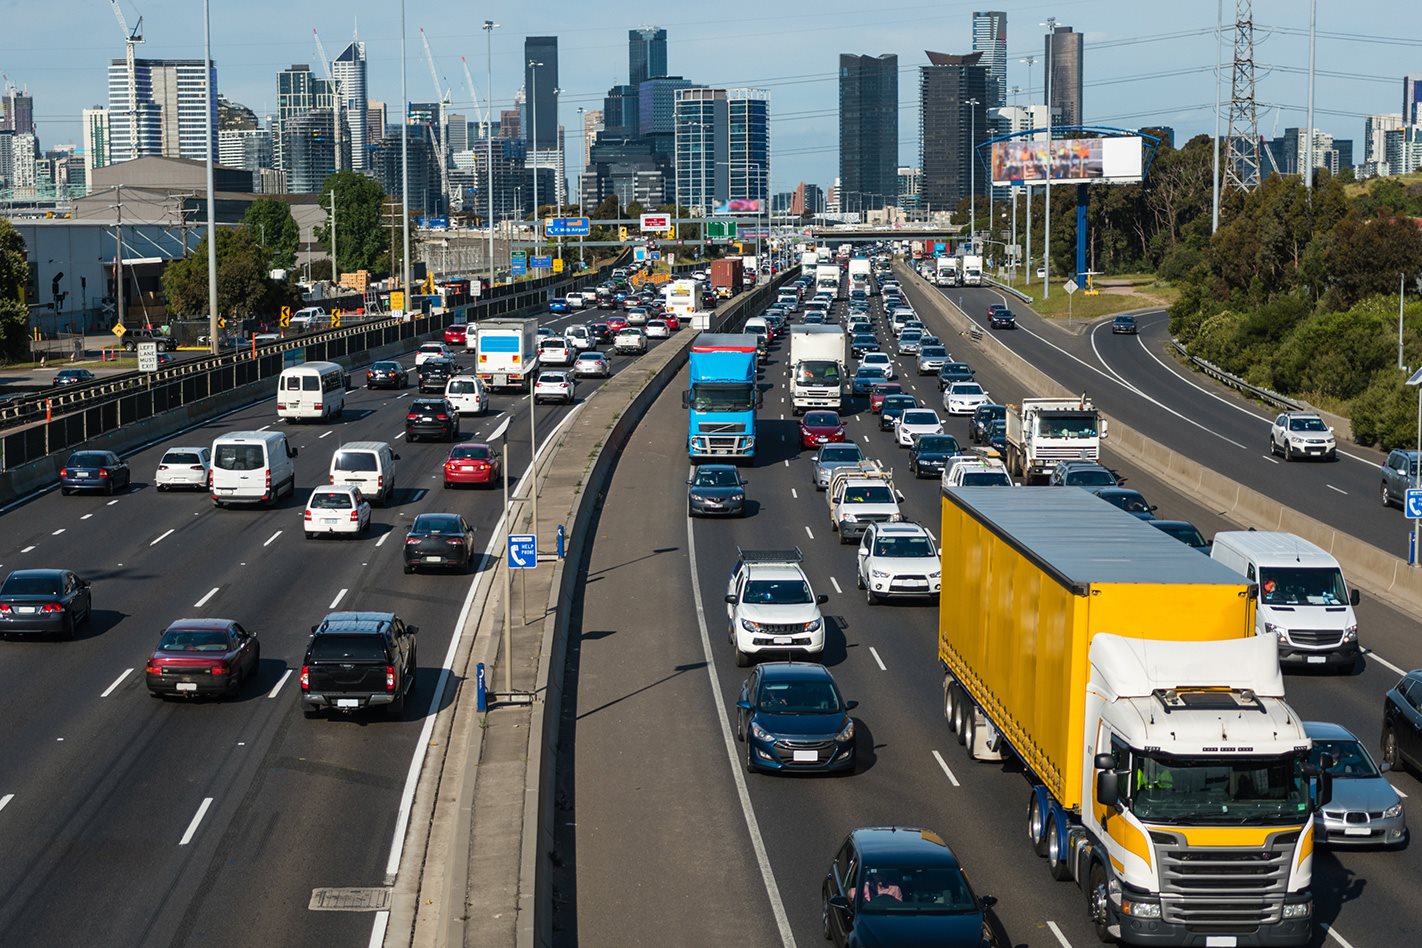
The Australian Automobile Association has released its latest Transport Affordability Index, with data collected over the final quarter of 2016 revealing that car ownership, when judged as a national average, takes up 13.6 percent of the typical Australian household’s income – an increase of 0.2 percent over the previous quarter.
The index also covers every capital city and weighs vehicle-related ownership expenses like tax, insurance, maintenance, fuel consumption, finance and tollways against the median income. The cost of public transport is also taken into account, but usually pales in comparison to vehicle costs. Depreciation isn’t factored in, nor are parking or air travel expenses.
1
The Index uses a hypothetical household made up of two adults, children and two cars (one ten years old, the other near-new) earning the average wage for that particular city. One adult in this hypothetical family unit also travels to and from their suburban home to the city every weekday.
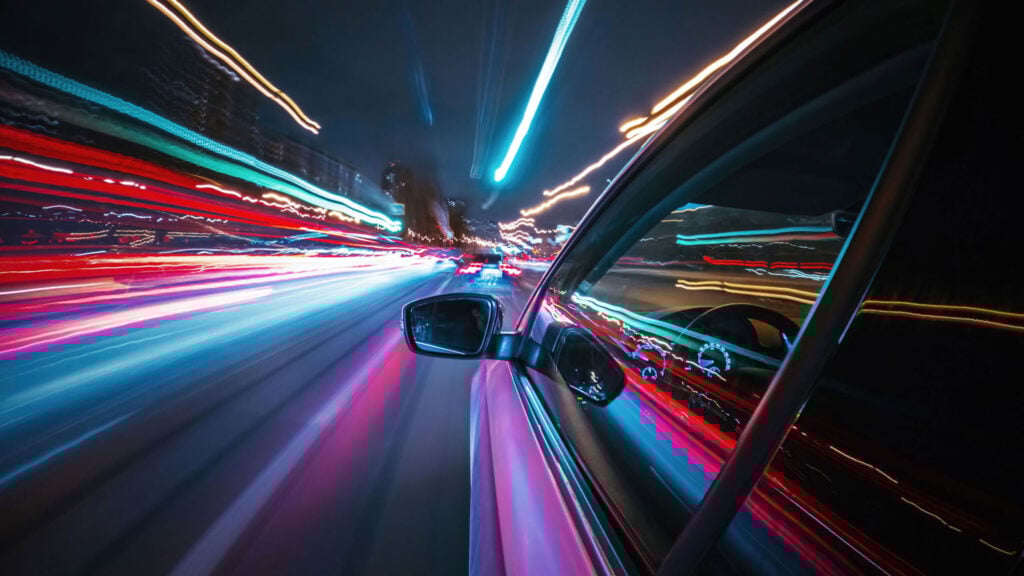
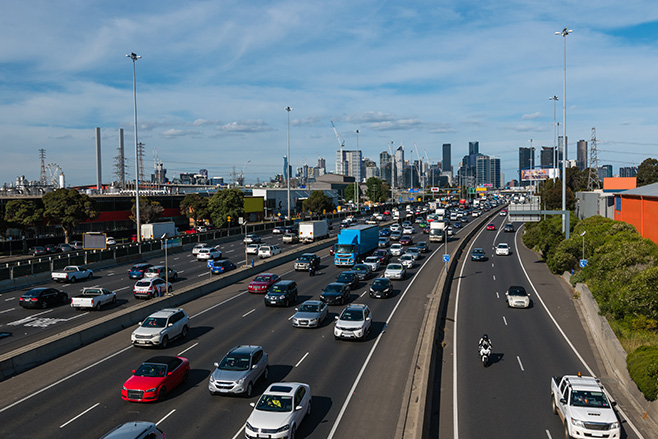
For the fourth quarter of last year, the index found Sydney and Melbourne, the two most populous cities in Australia, endured the biggest rise in household transport expenses, with annual costs jumping by $397 in Sydney and $519 in Melbourne.
Fuel was the greatest driver of those increases, though tolls also took a heavier, toll on transport expenses too. In fact, if toll costs were ignored, Perth would have overtaken Melbourne to come in at fourth most-expensive overall.
1
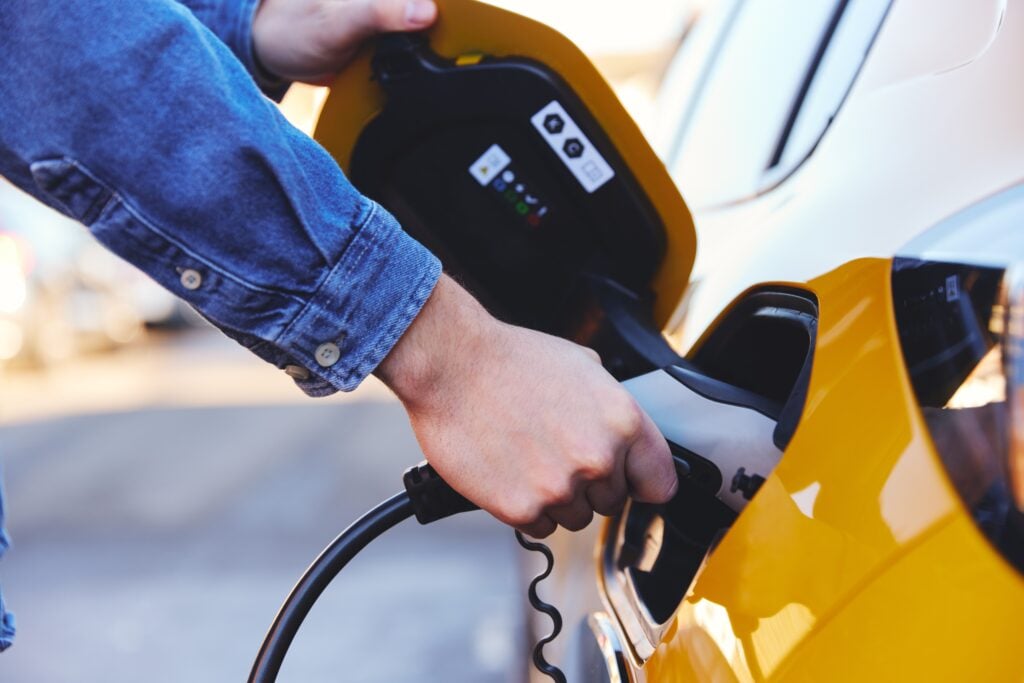
That said, according to the index the biggest single expense that car-owning households have to deal with continues to be car repayments, accounting for at least $120 per week on average – roughly a third of total weekly transport costs. Fuel, the next-biggest expense, comes in at roughly half that amount.
Average annual transports costs in Sydney were the highest by far, with the typical family spending $22,050 per year on mobility. Brisbane came in second with an annual cost of $19,409, despite being the only city to see a reduction in transport costs compared to the previous quarter.
Meanwhile Hobart was the lowest with a 12-month total of $14,438. Smaller cities typically fared better due to costs for public transport, driver’s licences and vehicle registration being less costly than in Australia’s major population centres on the East Coast. The absence of toll roads in cities like Adelaide, Hobart, Canberra and Darwin also helped keep transport expenses low.
Follow WhichCar/Wheels on Google
Click the button below to make WhichCar by Wheels a preferred source for your news.